Code
plots$econ <- get_dimension_ggraph(
  framework_df = tree,
  include_metrics = TRUE,
  dimension_in = 'economics',
  y_limits = c(-3.75, 3.25),
  palette = "scico::batlowW"
)
plots$econ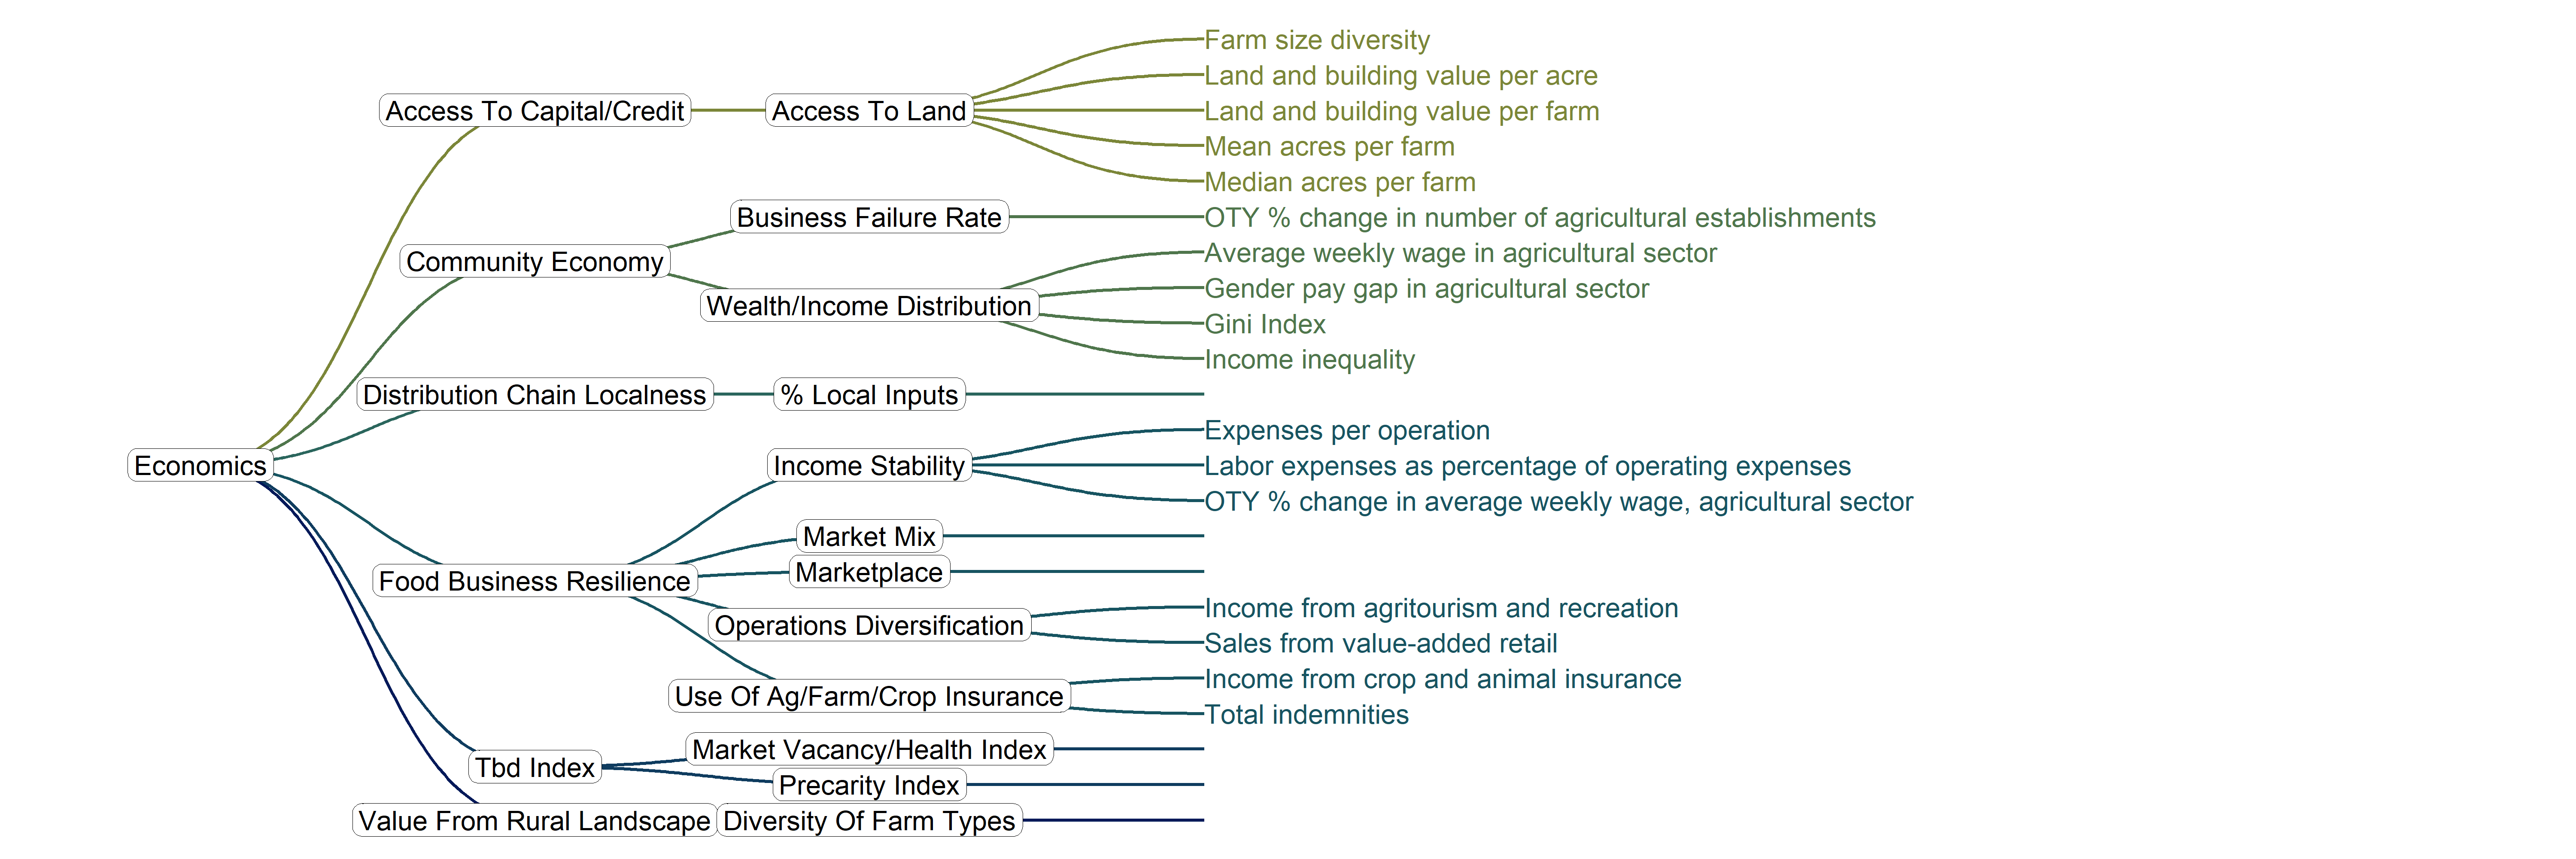
The Sustainability Metrics project, as well as this site itself, are works in progress. All data and analyses shown here are preliminary.
This group of pages will present a survey of secondary data at the regional/county level in the Northeast. Add more context here eventually.
plots$econ <- get_dimension_ggraph(
framework_df = tree,
include_metrics = TRUE,
dimension_in = 'economics',
y_limits = c(-3.75, 3.25),
palette = "scico::batlowW"
)
plots$econ
plots$env <- get_dimension_ggraph(
  framework_df = tree,
  include_metrics = TRUE,
  dimension_in = 'environment',
  y_limits = c(-4.5, 3.25),
  palette = "scico::batlowW"
)
plots$env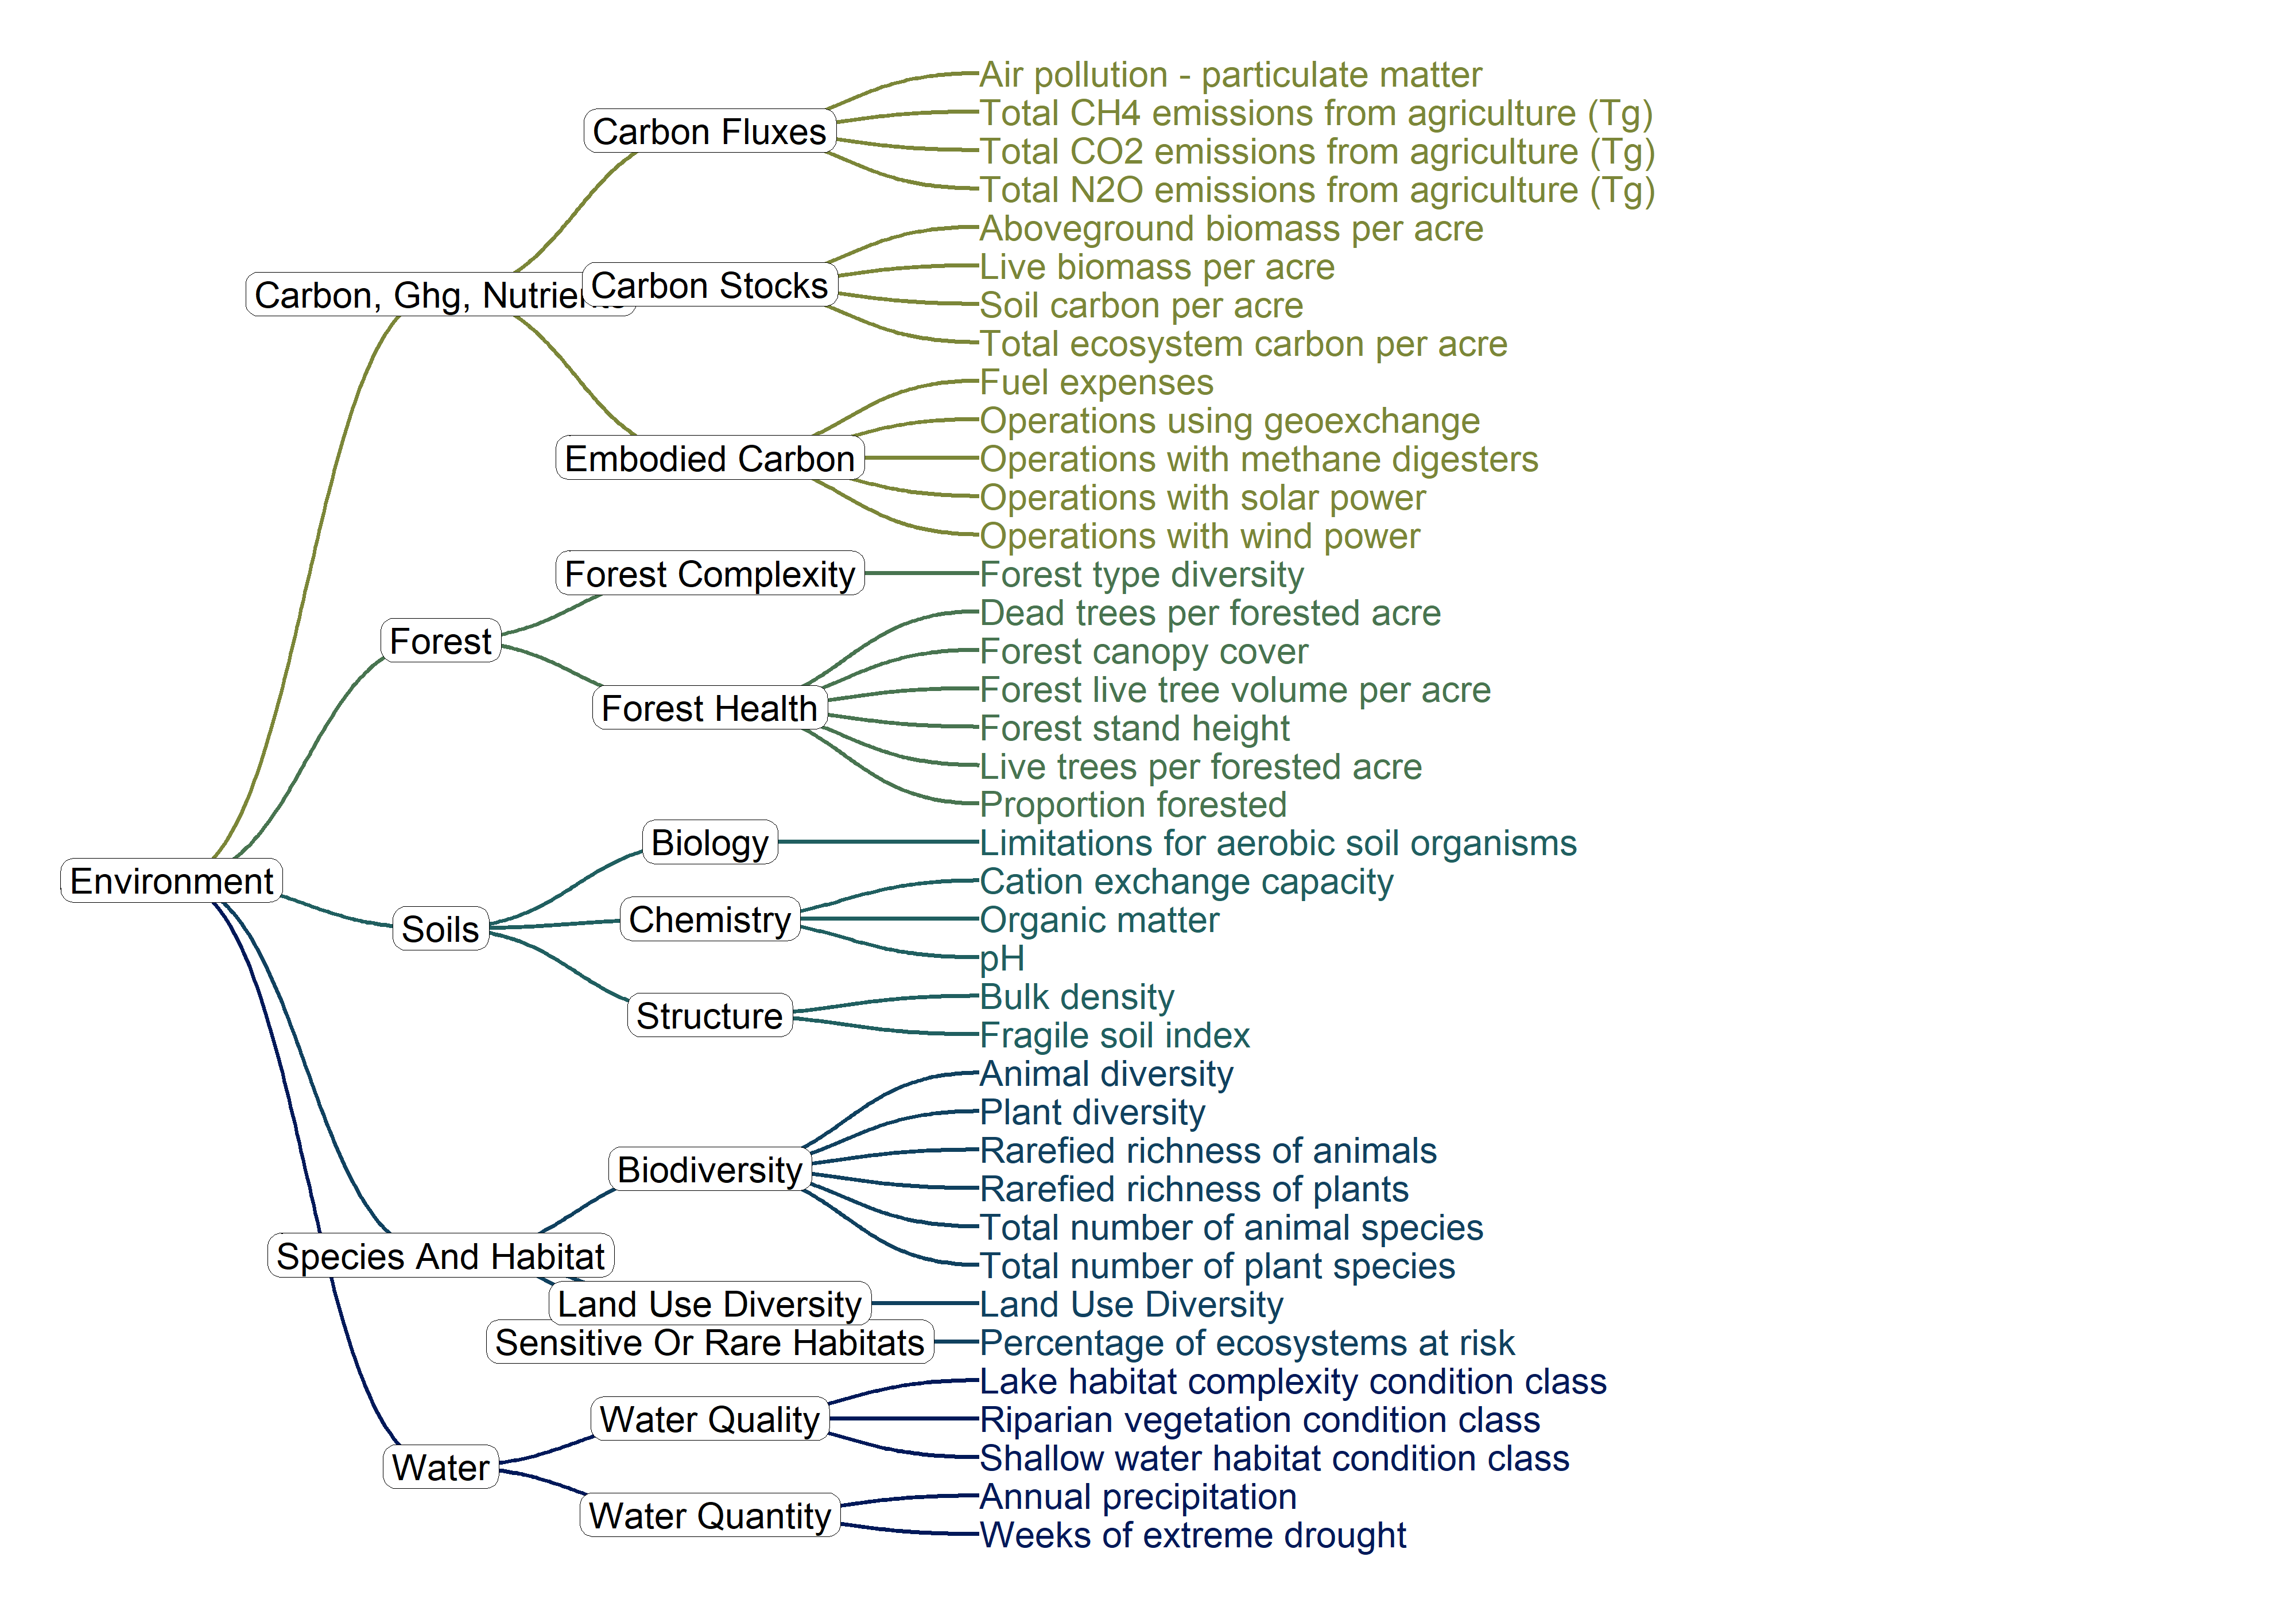
plots$health <- get_dimension_ggraph(
  framework_df = tree,
  include_metrics = TRUE,
  dimension_in = 'health',
  y_limits = c(-4.5, 3.25),
  palette = "scico::batlowW"
)
plots$health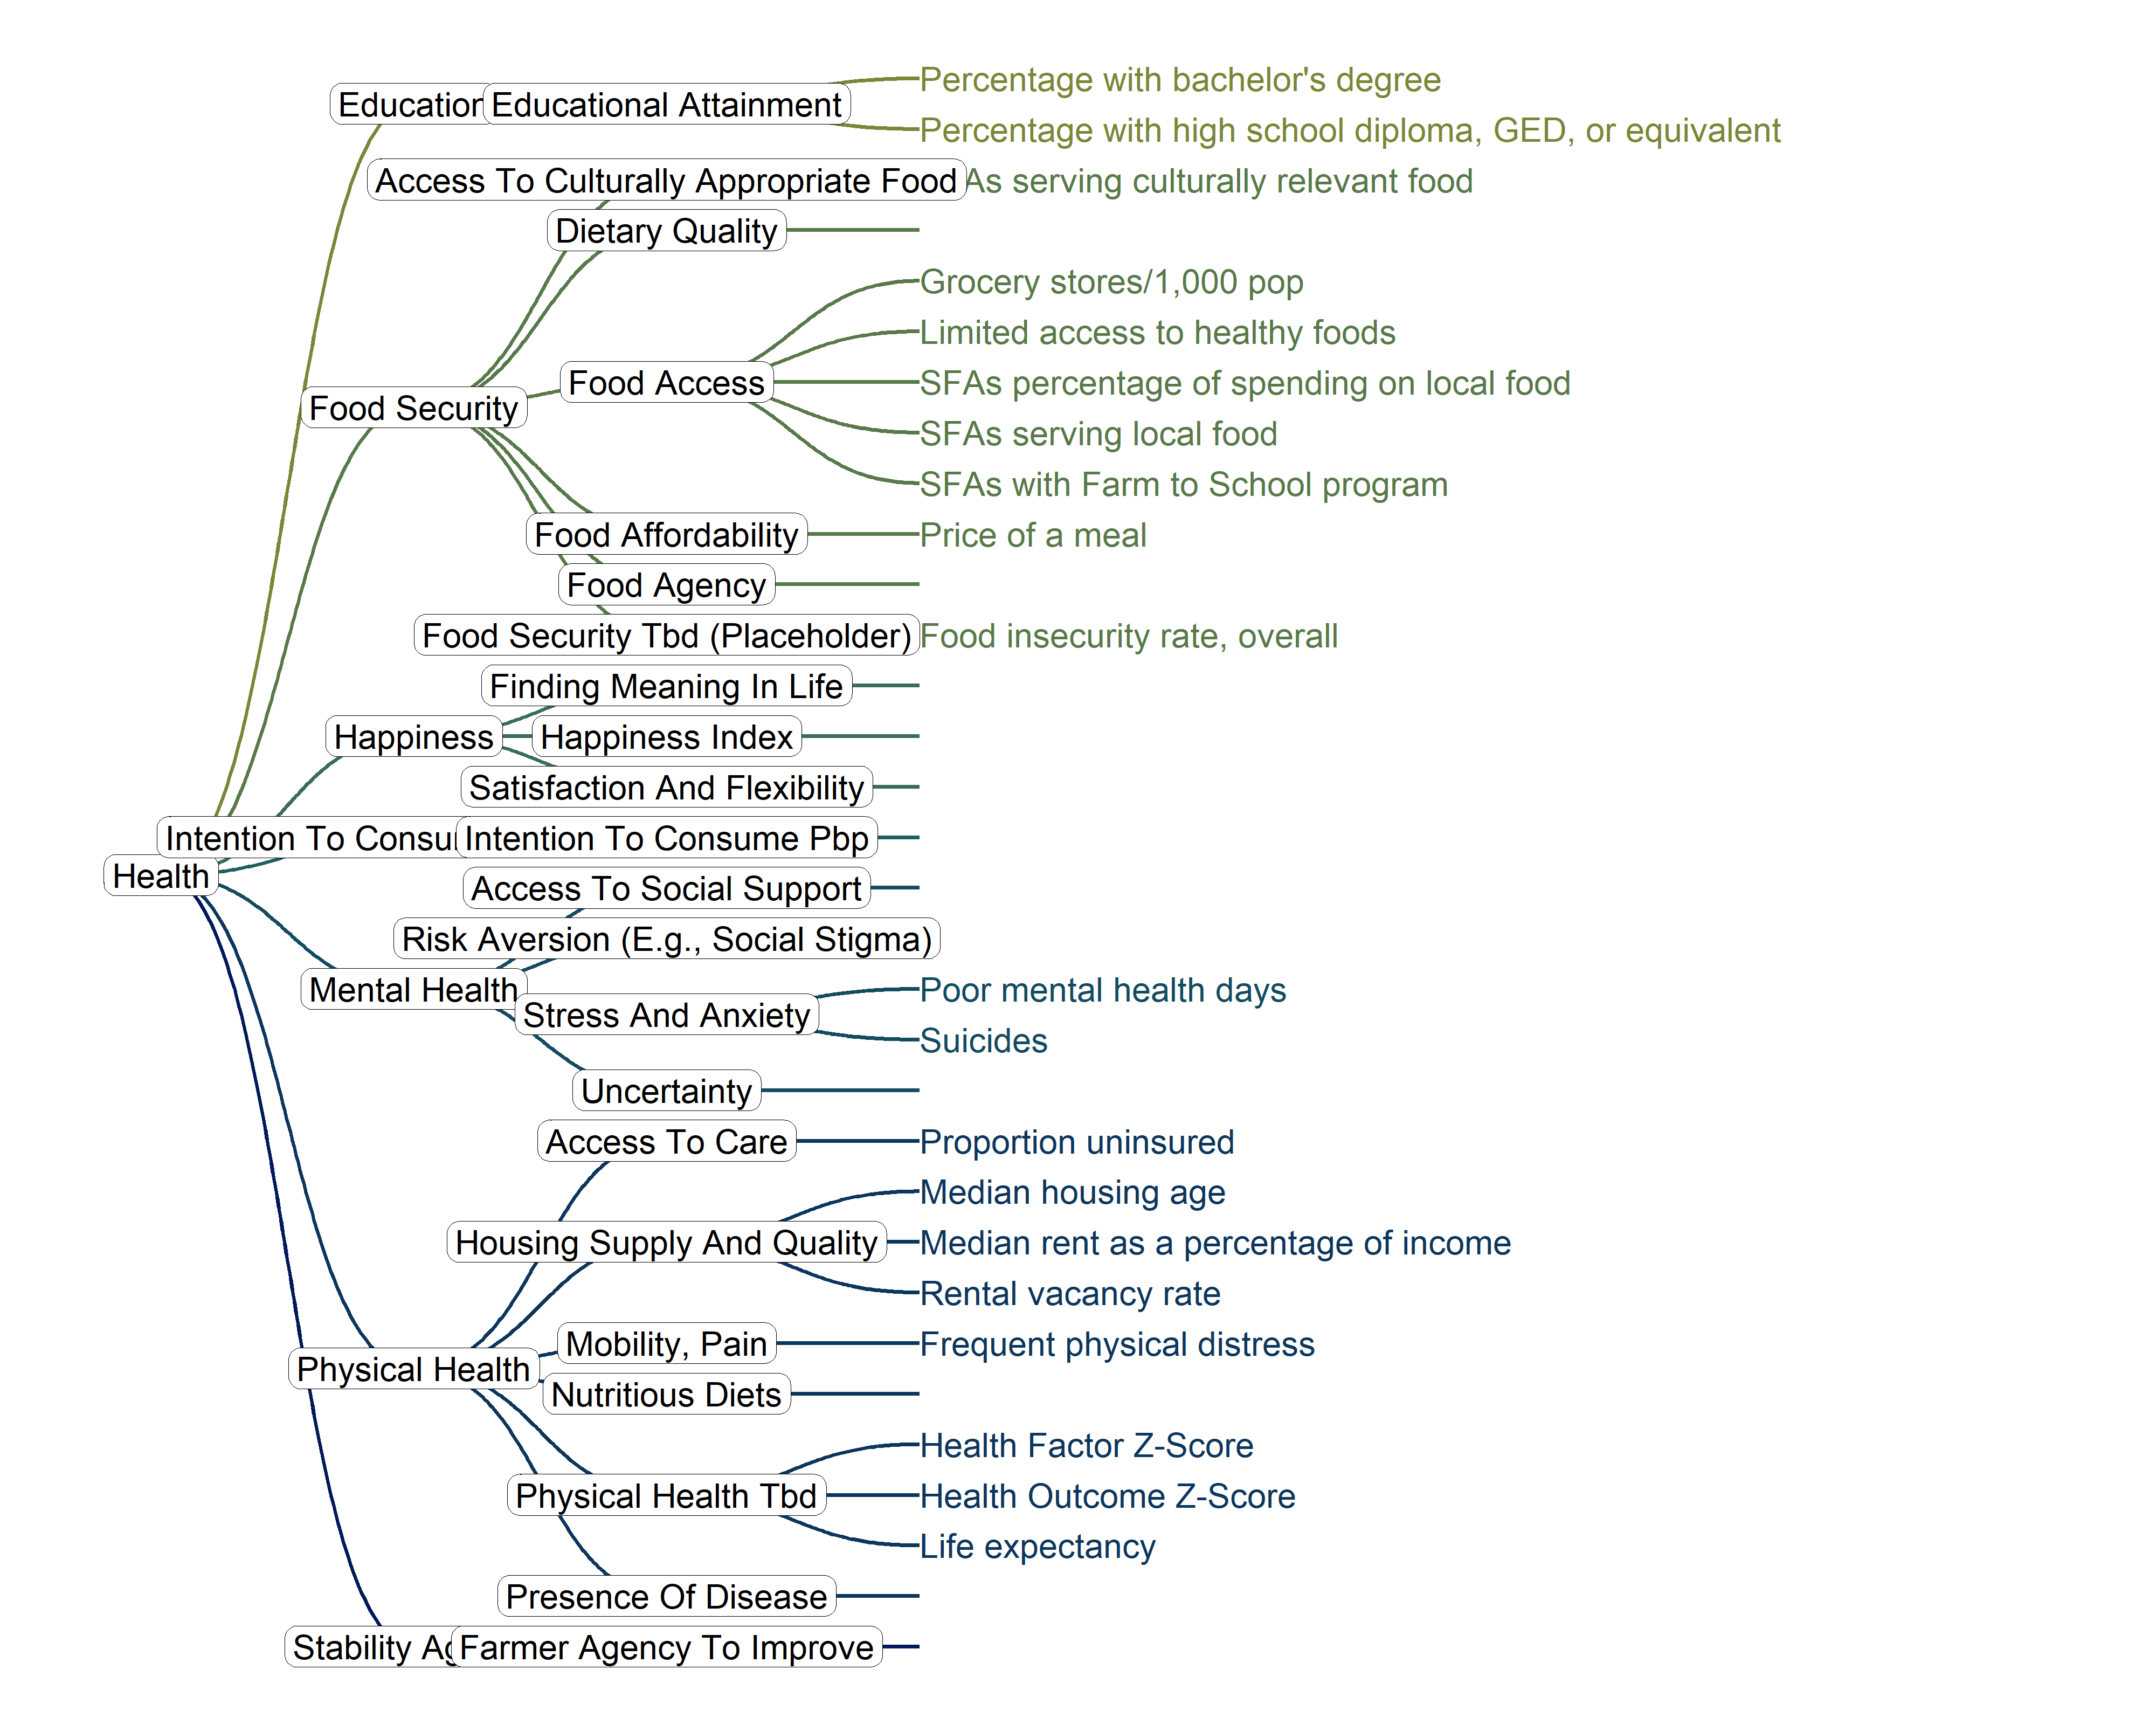
plots$prod <- get_dimension_ggraph(
  framework_df = tree,
  include_metrics = TRUE,
  dimension_in = 'production',
  y_limits = c(-4.5, 3.25),
  palette = "scico::batlowW"
)
plots$prod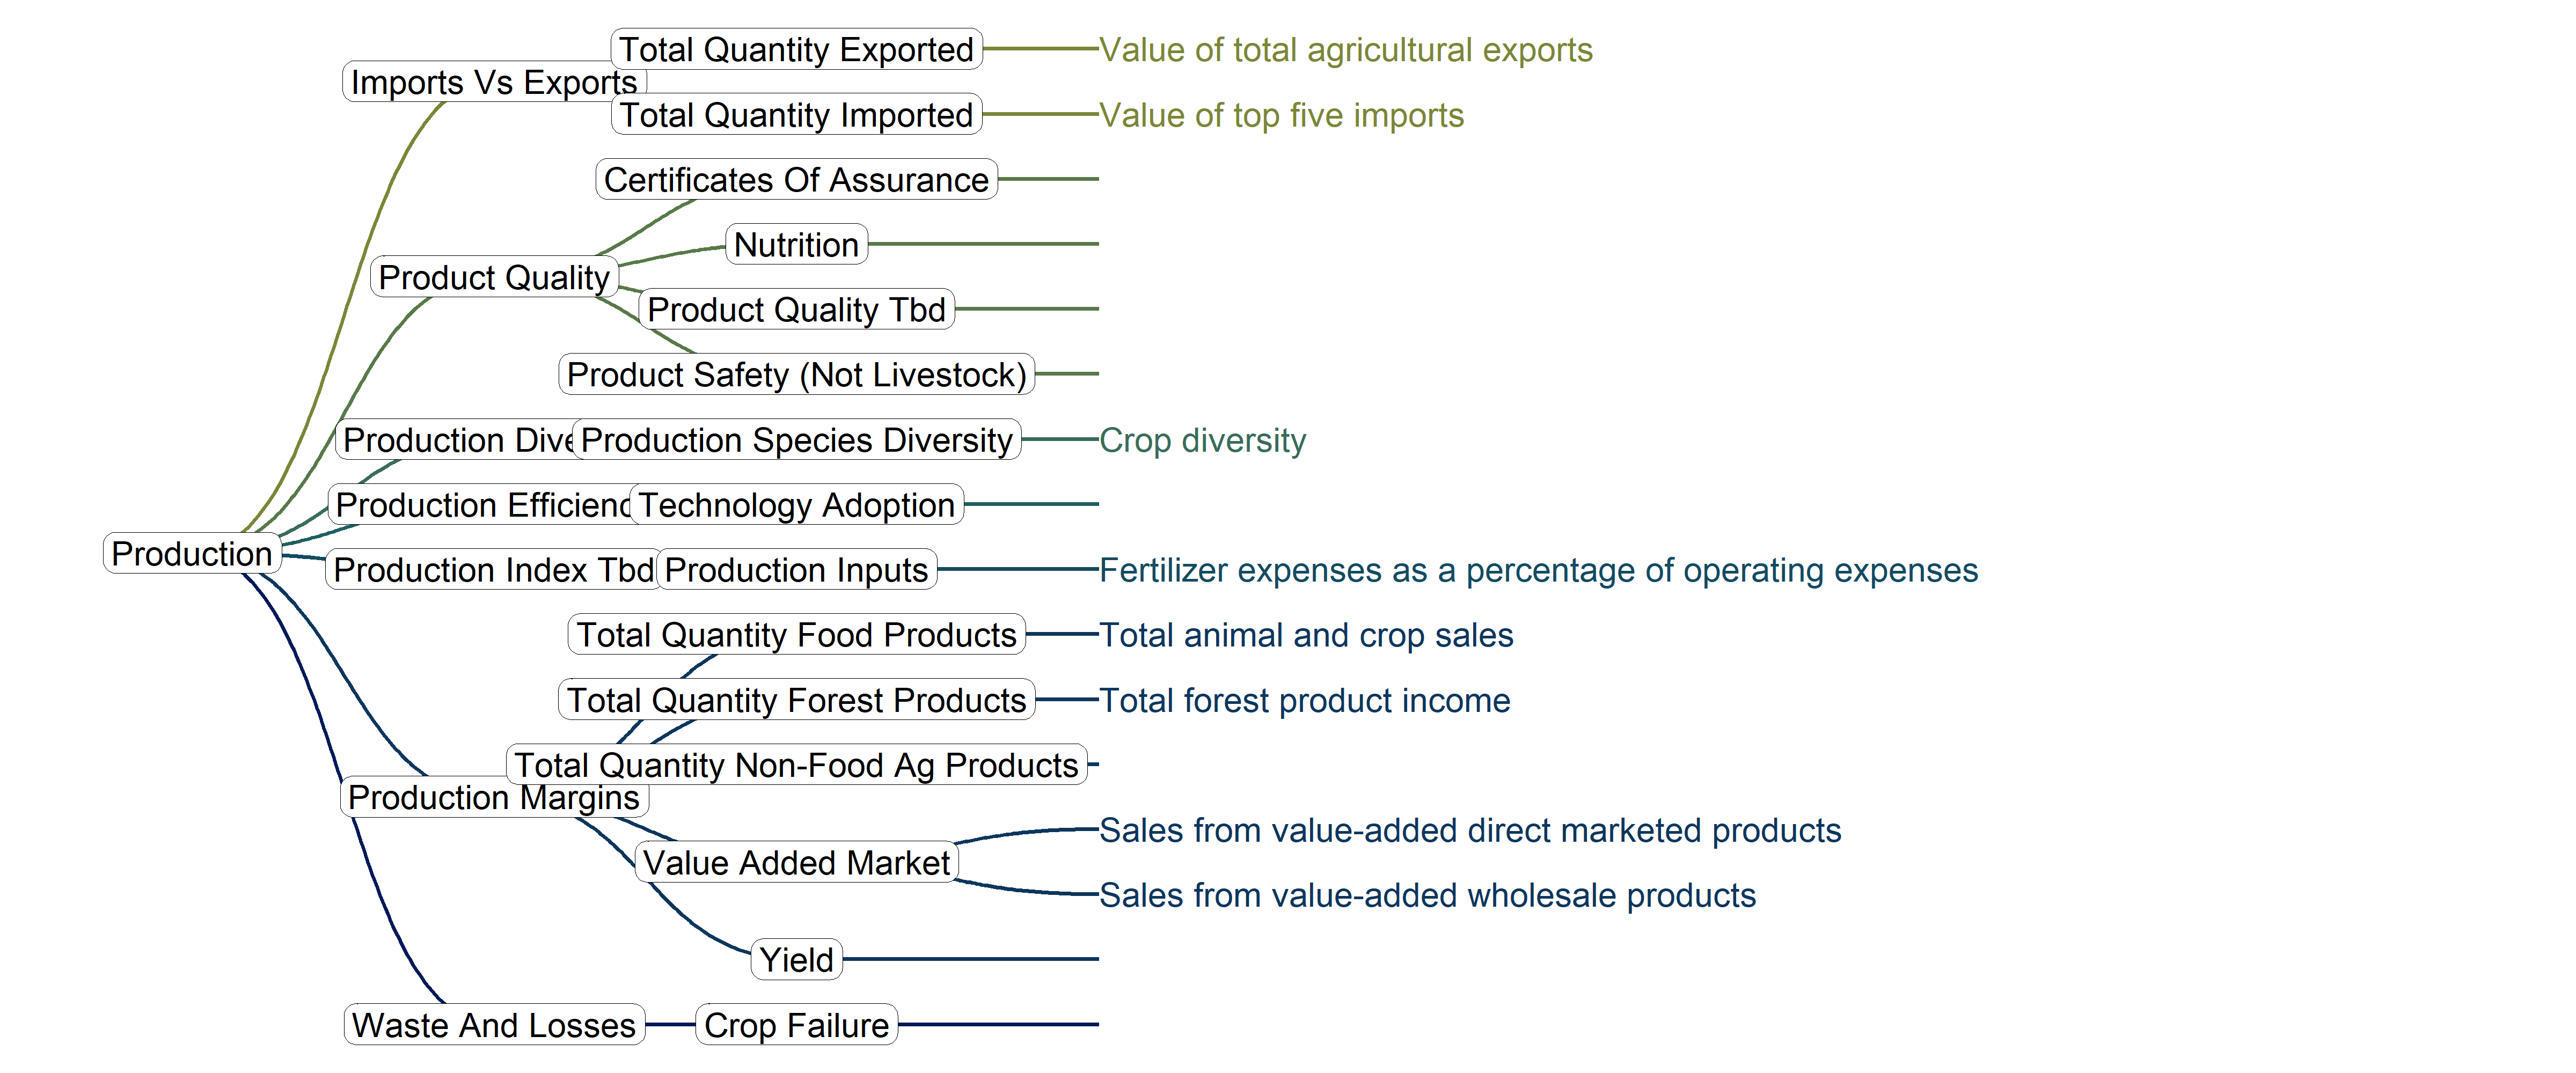
data_paper_tree %>%
  mutate(metric = case_when(
    str_detect(metric, 'NONE') ~ NA,
    .default = metric
  )) %>%
  arrange(dimension, index, indicator, metric) %>%
  get_reactable()
2.5 Social
Code