This page shows the partially refined framework as it stands after three dimension meetings: economics, environment, and production. It also includes a selection of preliminary secondary data metrics to match those indicators. Effectively, we have around 650 meaningful metrics. Here, we are using a selection of 124 of them to make a skeleton framework for preliminary analyses.
Note that where I have no metrics to represent an indicator, the metric column is blank. This does not mean that secondary data do not exist, just that I either haven’t found it or haven’t cleaned and wrangled it yet. If you know of any secondary data to fill in the gaps or improve on data we already have, please do reach out to let Chris know about it.
At the bottom of this page is a metadata table with sources and definitions for all the metrics.
The rest of this section will present preliminary analyses at the national/state level as a trial run for regional analyses. State level data are easier to find and state boundaries don’t change very often (unlike counties, which actually did change in Connecticut in 2022 and throw a wrench into any kind of trend analysis).
1 Partially Refined Framework
Here is the framework with a selection of secondary metrics, split into each dimension for ease of reading.
Code
# Load refined framework. We are leaving this here during rework so other pages work. It is now old thoughsm_data <-readRDS('data/sm_data.rds')old_frame <- sm_data[['refined_tree']]# Clean up the framework df old_frame <- old_frame %>%select(dimension:variable_name, use) %>%filter(use =='x') %>%select(-use) %>%mutate(metric =ifelse(str_length(metric) >45,paste0(str_sub(metric, end =45), '...'), metric ) )get_str(old_frame)# Save frame to rds for use in subsequent scriptssaveRDS(old_frame, 'data/frame.rds')saveRDS(old_frame, 'data/frameworks/frame.rds')## Bringing in new tree for RFPP example (fixed tree actually)# new_tree <- sm_data[['new_tree']]new_tree <- sm_data[['fixed_tree']]# Clean up the framework df frame <- new_tree %>%filter(index !='intention to consume pbp') %>%# remove duplicate# select(dimension:variable_name, use) %>% # filter(use == 'x') %>% # select(-use) %>% mutate(across(c(metric, indicator),~ifelse(str_length(.x) >45,paste0(str_sub(.x, end =45), '...'), .x )) )get_str(frame)# Save frame to rds for use in subsequent scriptssaveRDS(frame, 'data/frameworks/new_frame.rds')# Start a list to save outputs for presoplots <-list()
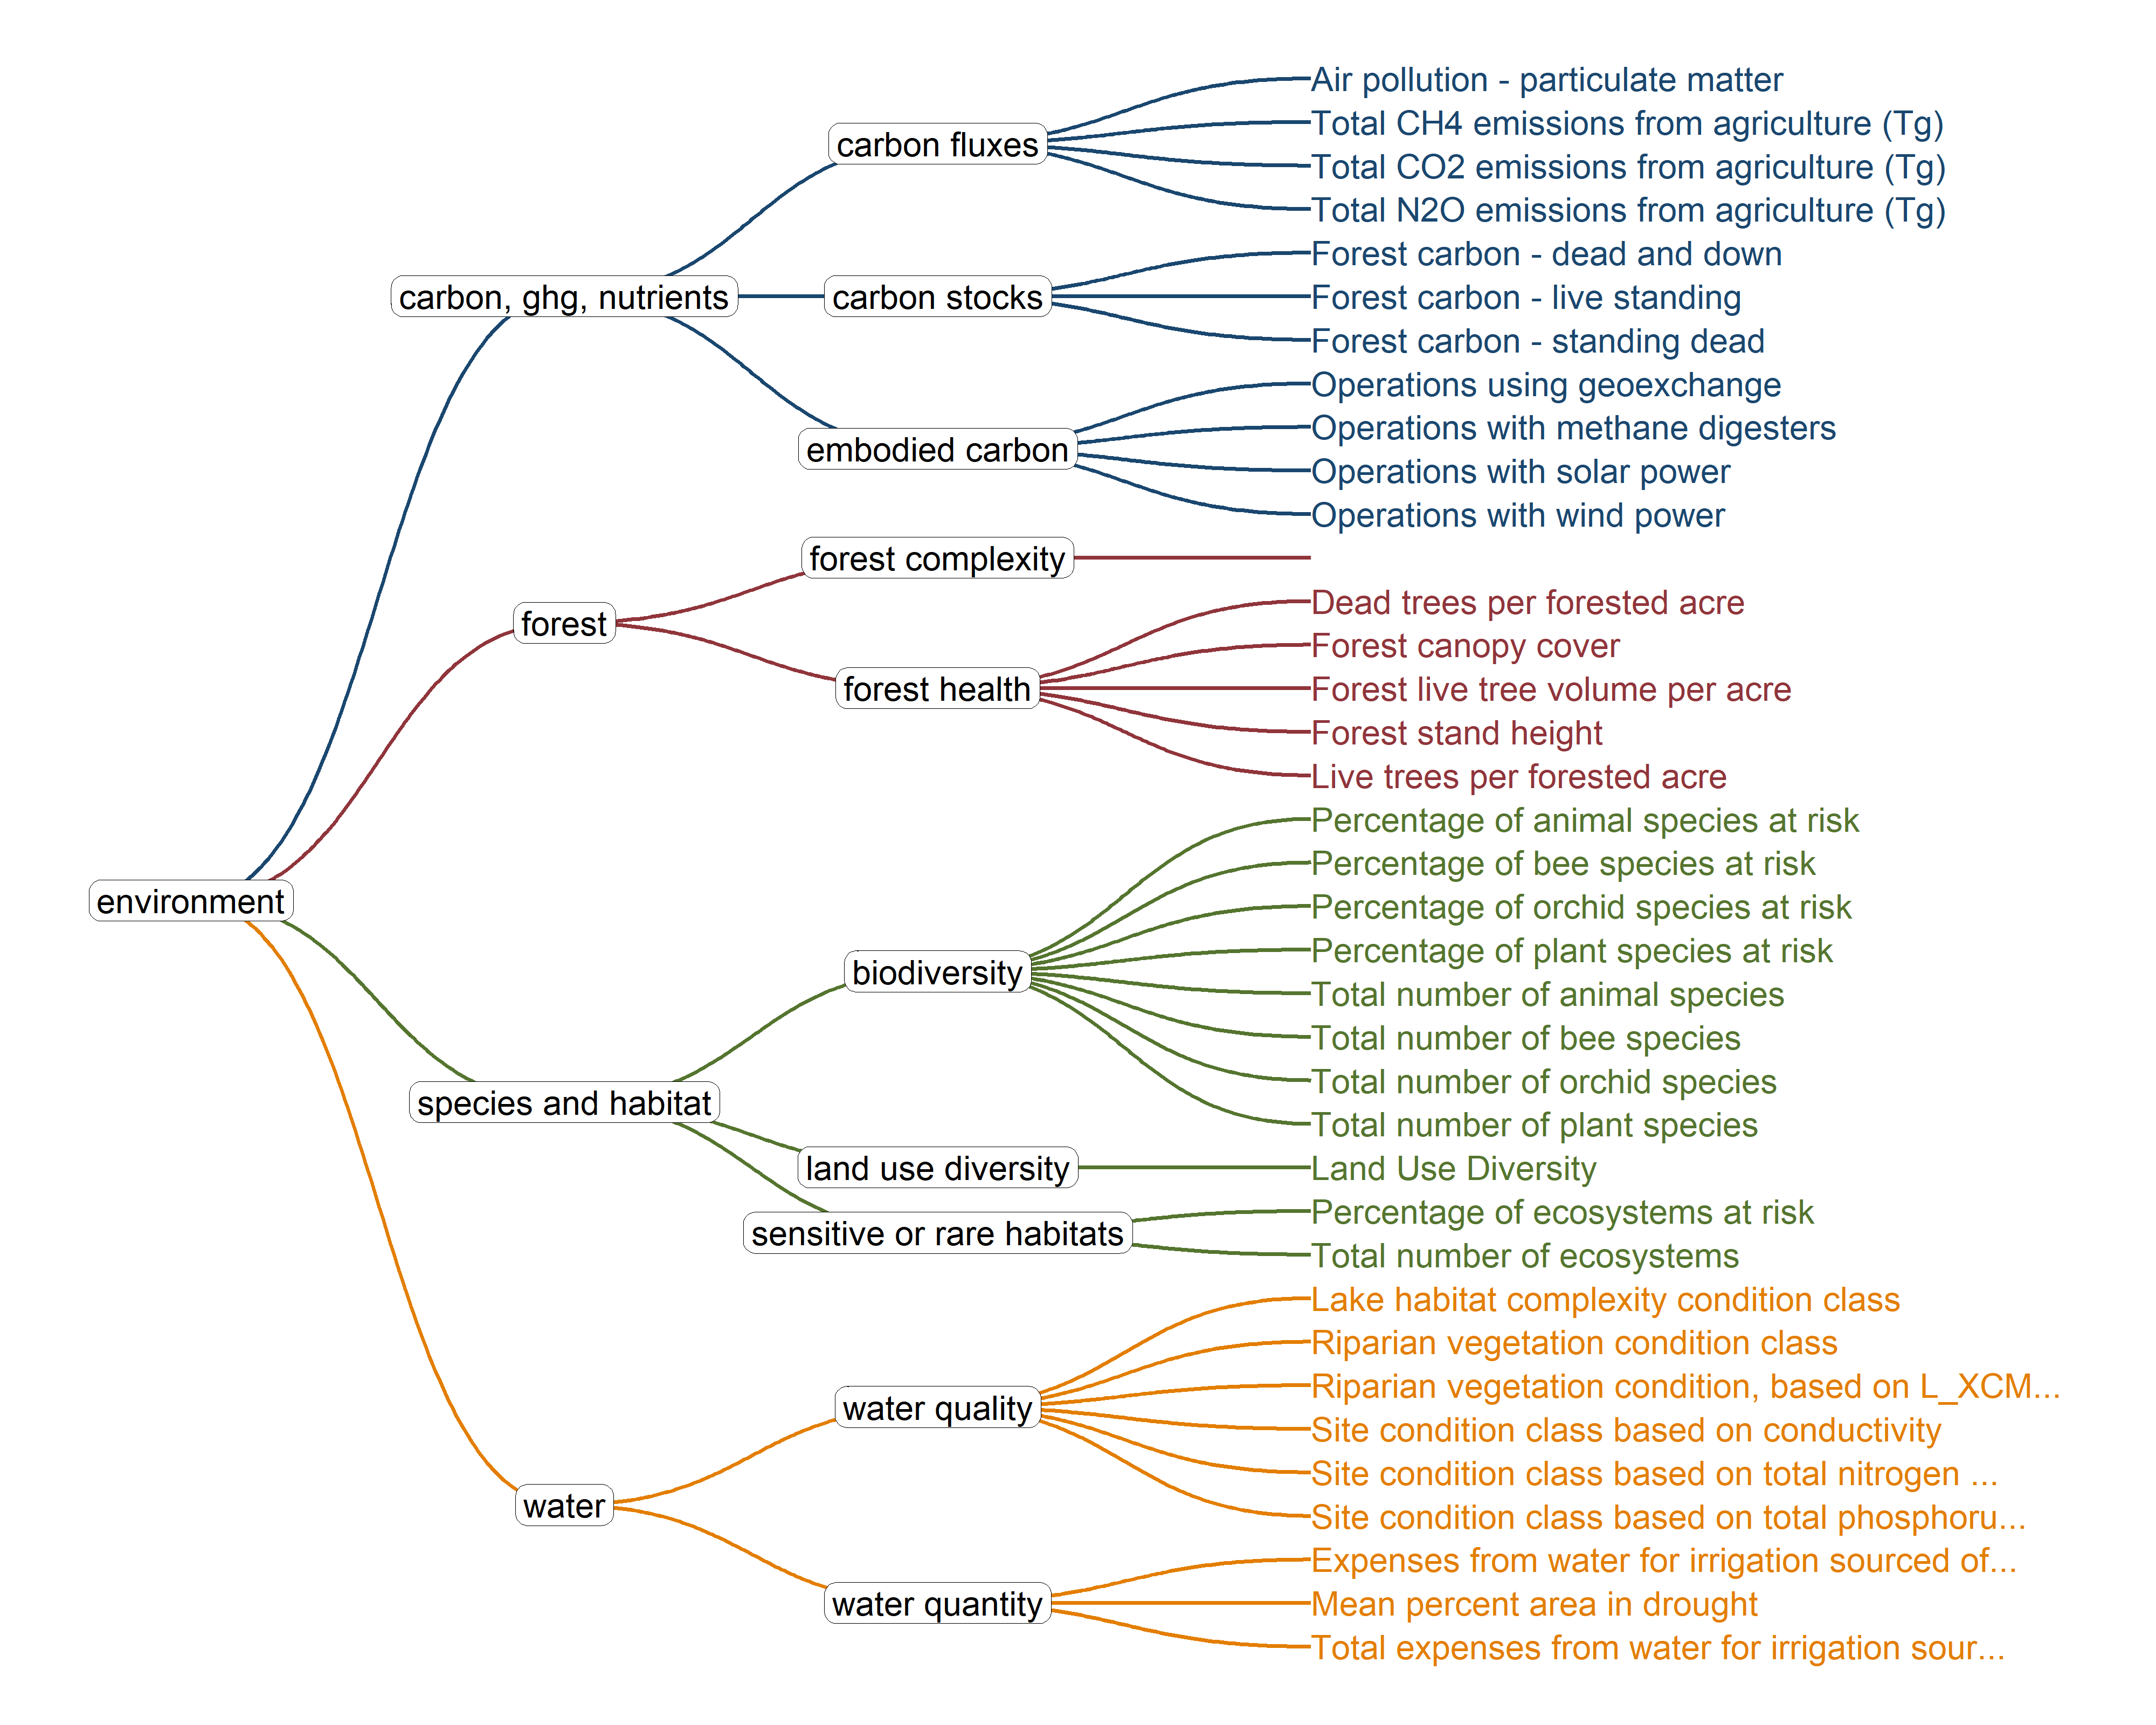
1.1 Environment
We have reasonable representation of the environment dimension, although some metrics are proxies that are stretched a bit too far. Some weak points are the carbon stocks indicator - so far, this is all from the TreeMap 2016 dataset, which has only been updated once since 2008. I would love to include other stocks of carbon if anyone has leads on datasets. The metrics for embodied carbon are also pretty big stretches.
One gap I’ve noticed since this dimension was reworked in the dimension meeting is that there is no direct treatment of soil health included anymore. We might add soil metrics for carbon stocks or forest health, but there is no clear home for it. And that being said, I have had no luck finding any reliable soil health datasets, so I’m all ears here too.
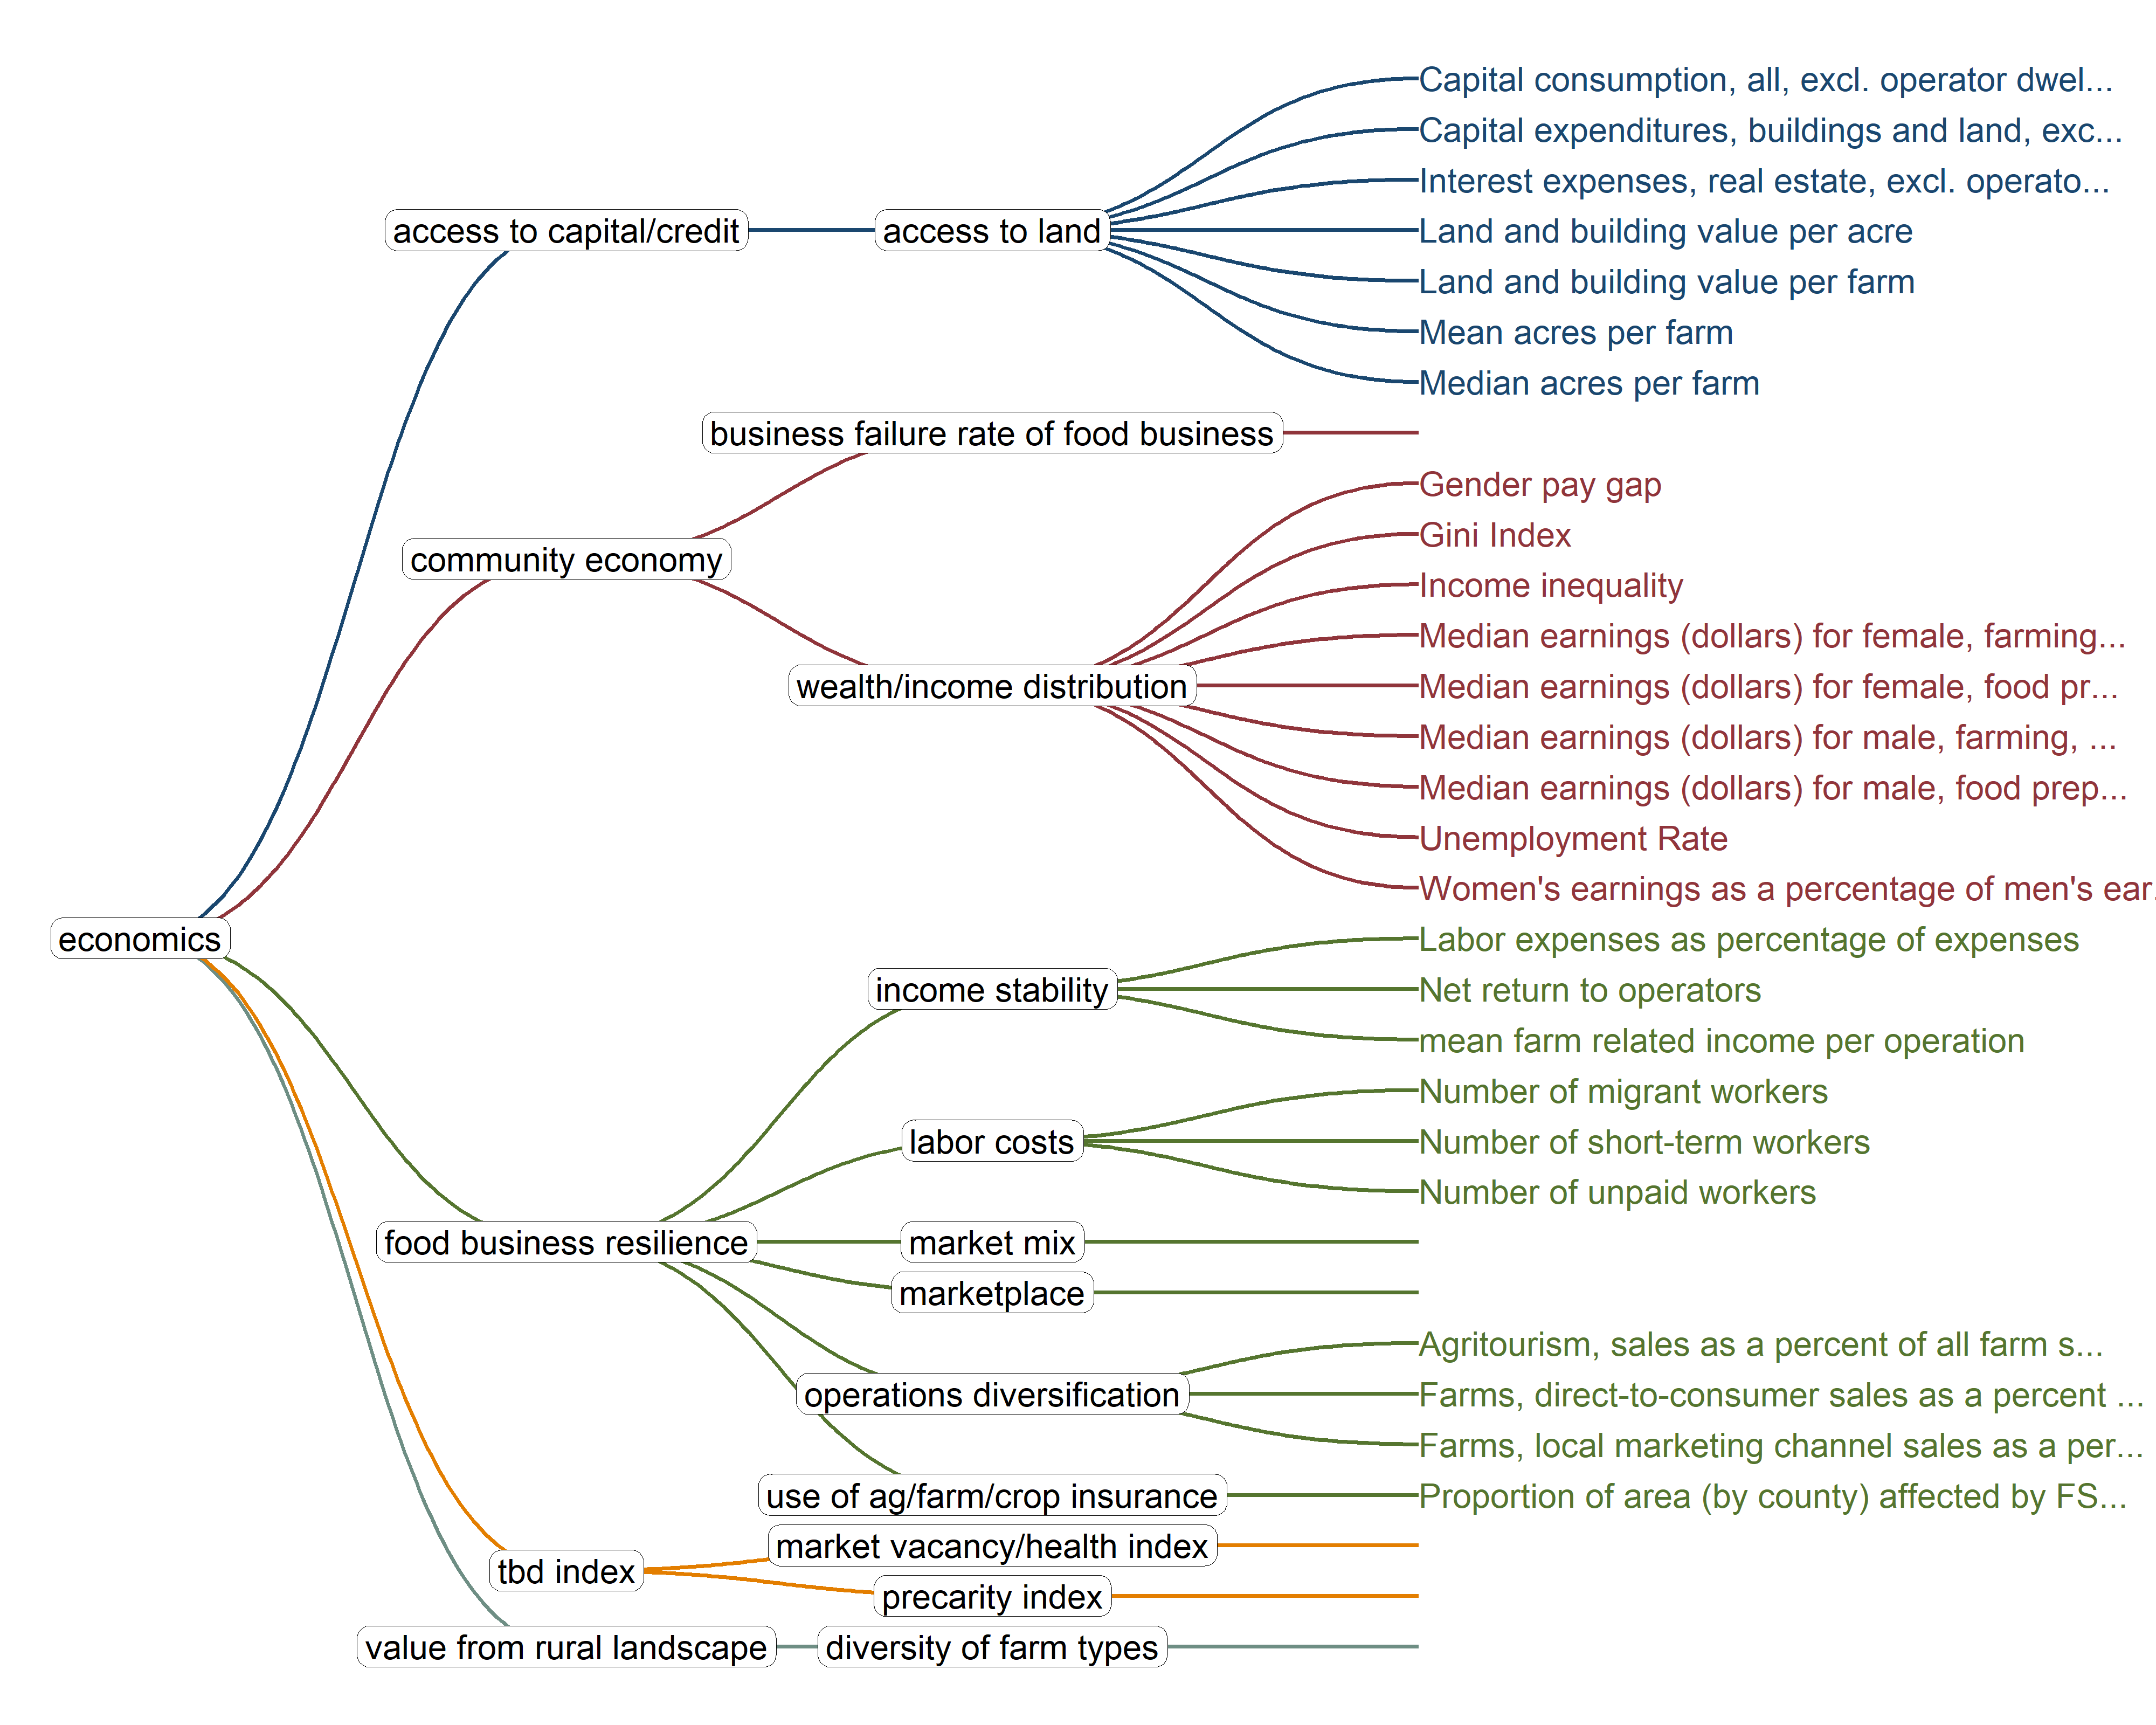
It has definitely been easier to find economics data than other dimensions. Worth noting here is that the access to land indicator is not ideal. I’m using value and farm size as a proxy for access. Use of crop insurance is also a proxy, since I could not find direct insurance claim data from FSA. So for now, we are just using the ag secretary declarations of disasters that allow for insurance claims as a proxy. The failure rate of food businesses should be available in BLS or ERS I believe, but I haven’t gotten around to wrangling and including it.
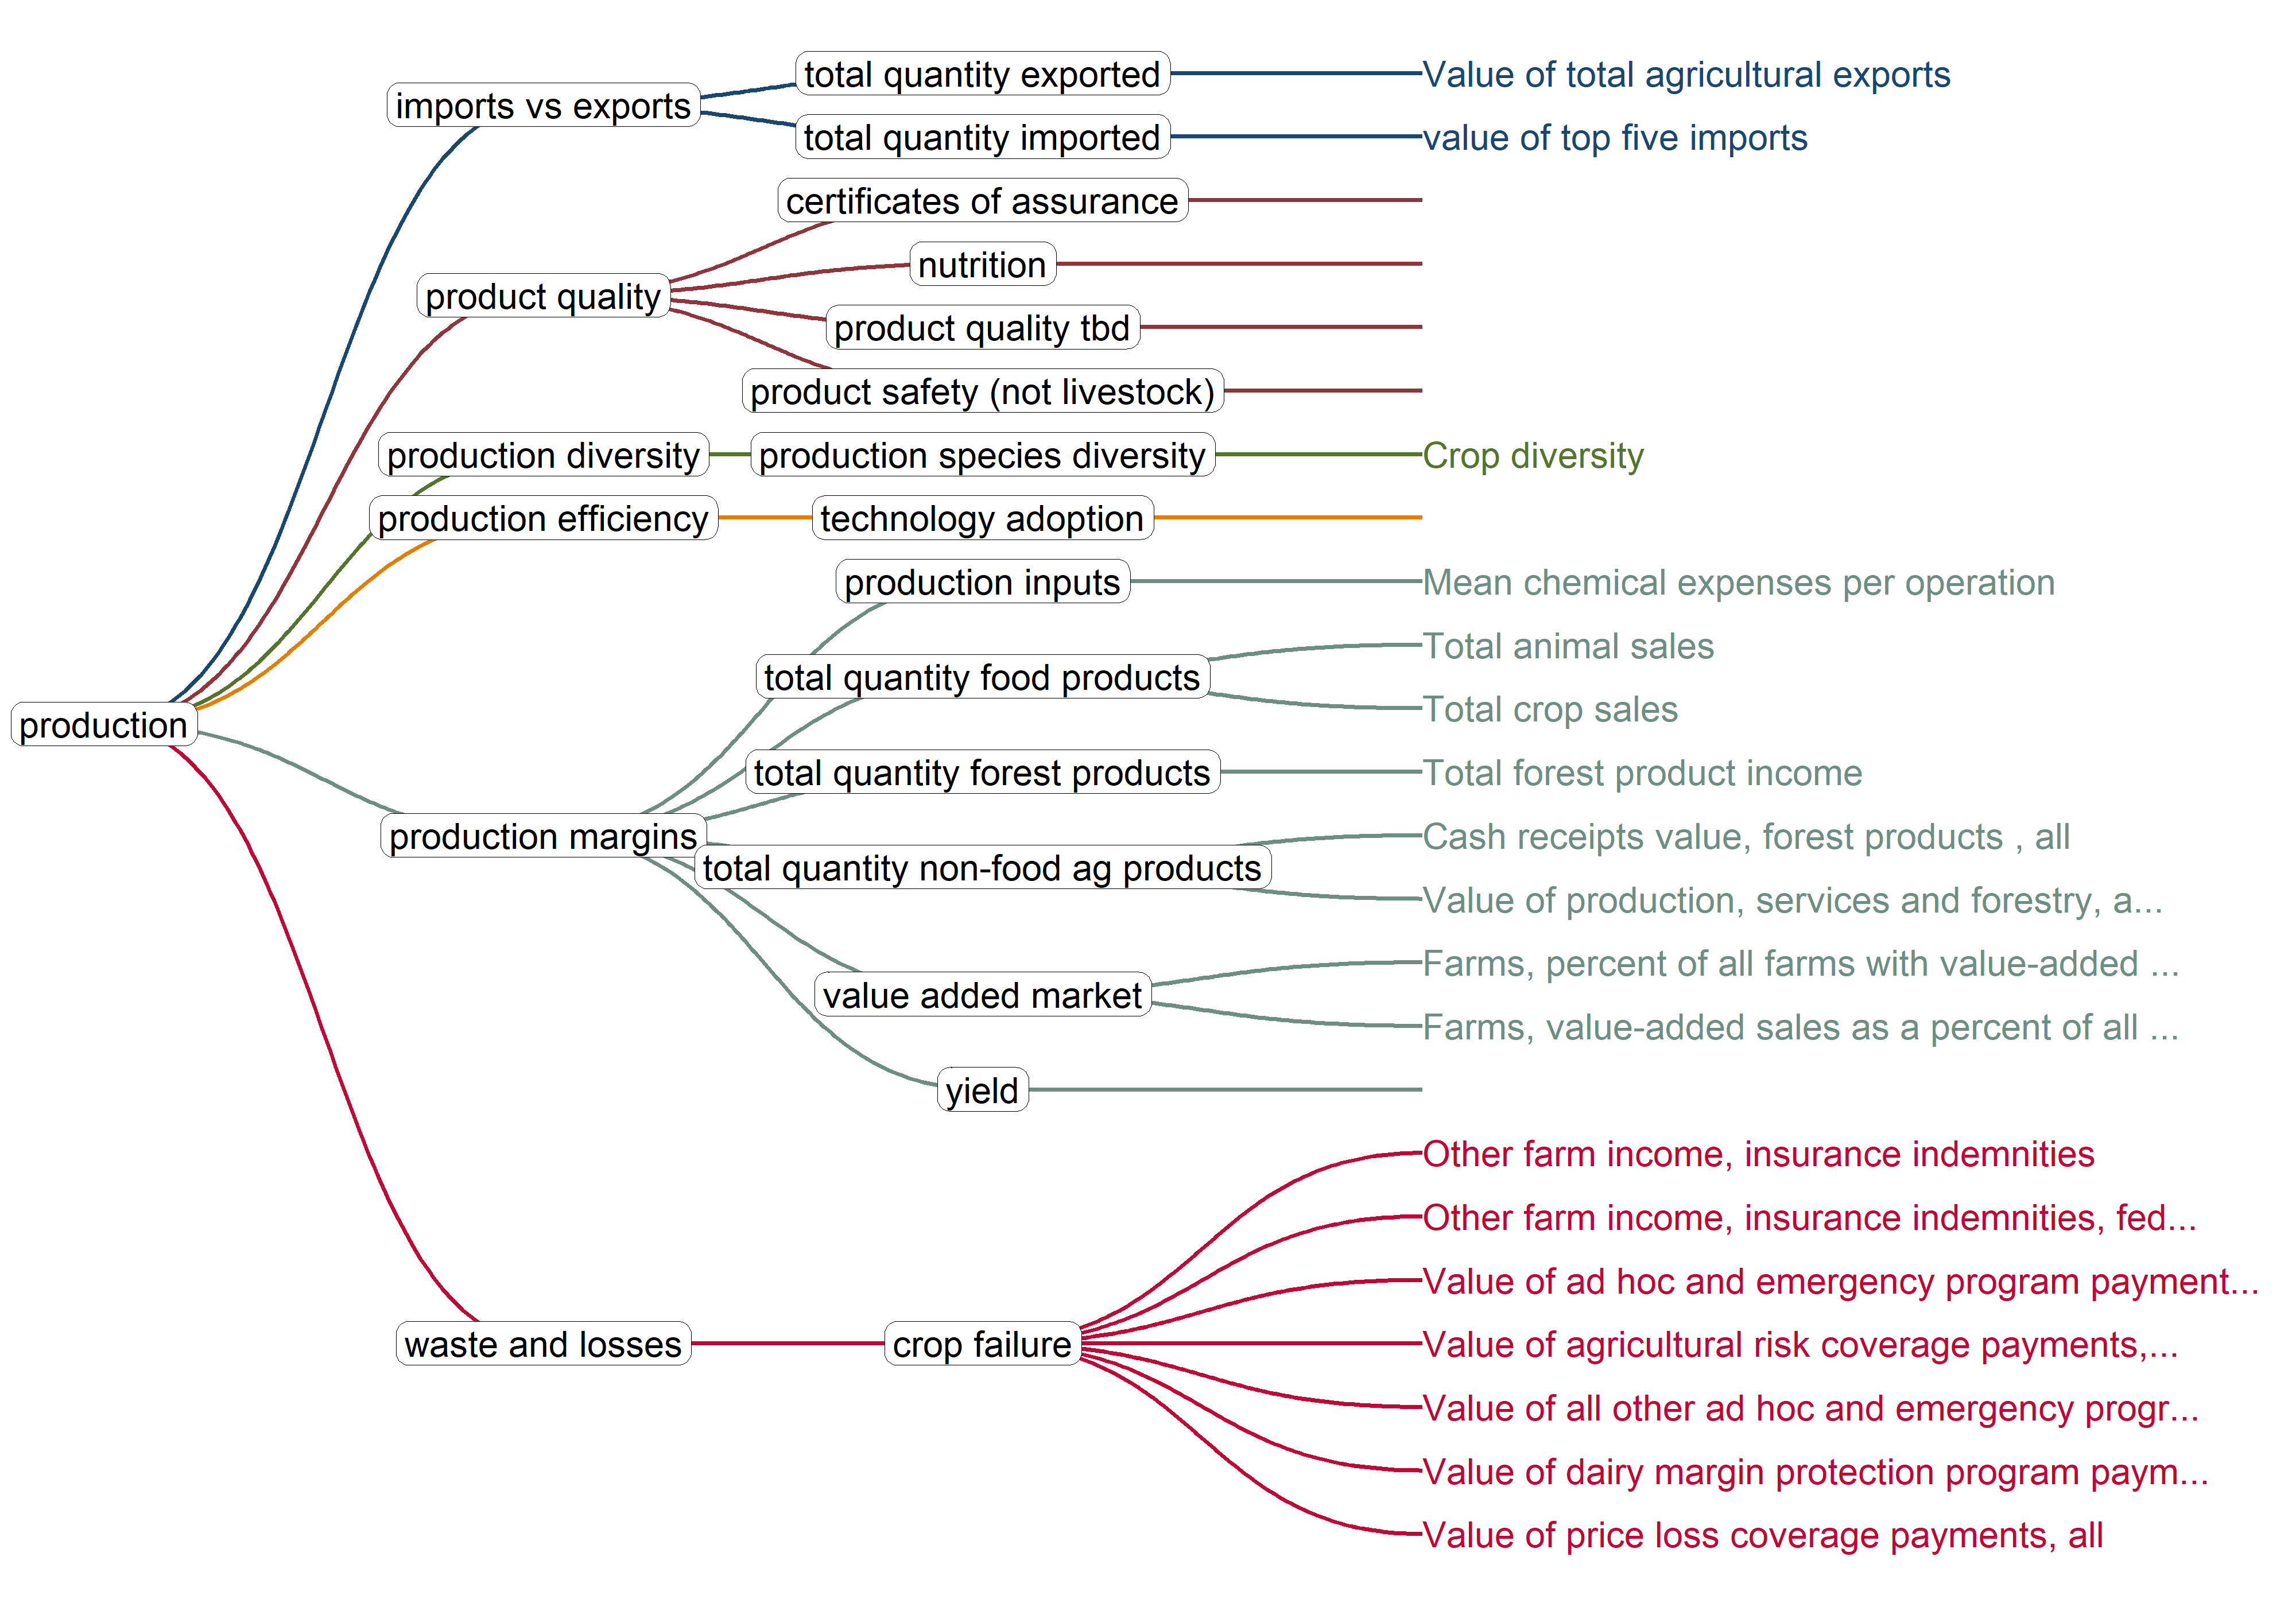
Agricultural exports are a pretty robust dataset at the state level from ERS, although the import data only includes the values of the top five imports for each state - not ideal. Crop diversity is based on the Cropland Data Layer, a USDA NASS spatial model estimating of crop types, which I used to calculate Shannon diversity at the county and state level. It turns out that this one does a particularly poor job of representing Vermont, as it focuses on commodity crops.
The rest of the metrics come from NASS. Production is an area in which I feel better about using NASS data than some other dimensions, but there is still some risk of these data not representing the kind of diversified systems found in Vermont very well.
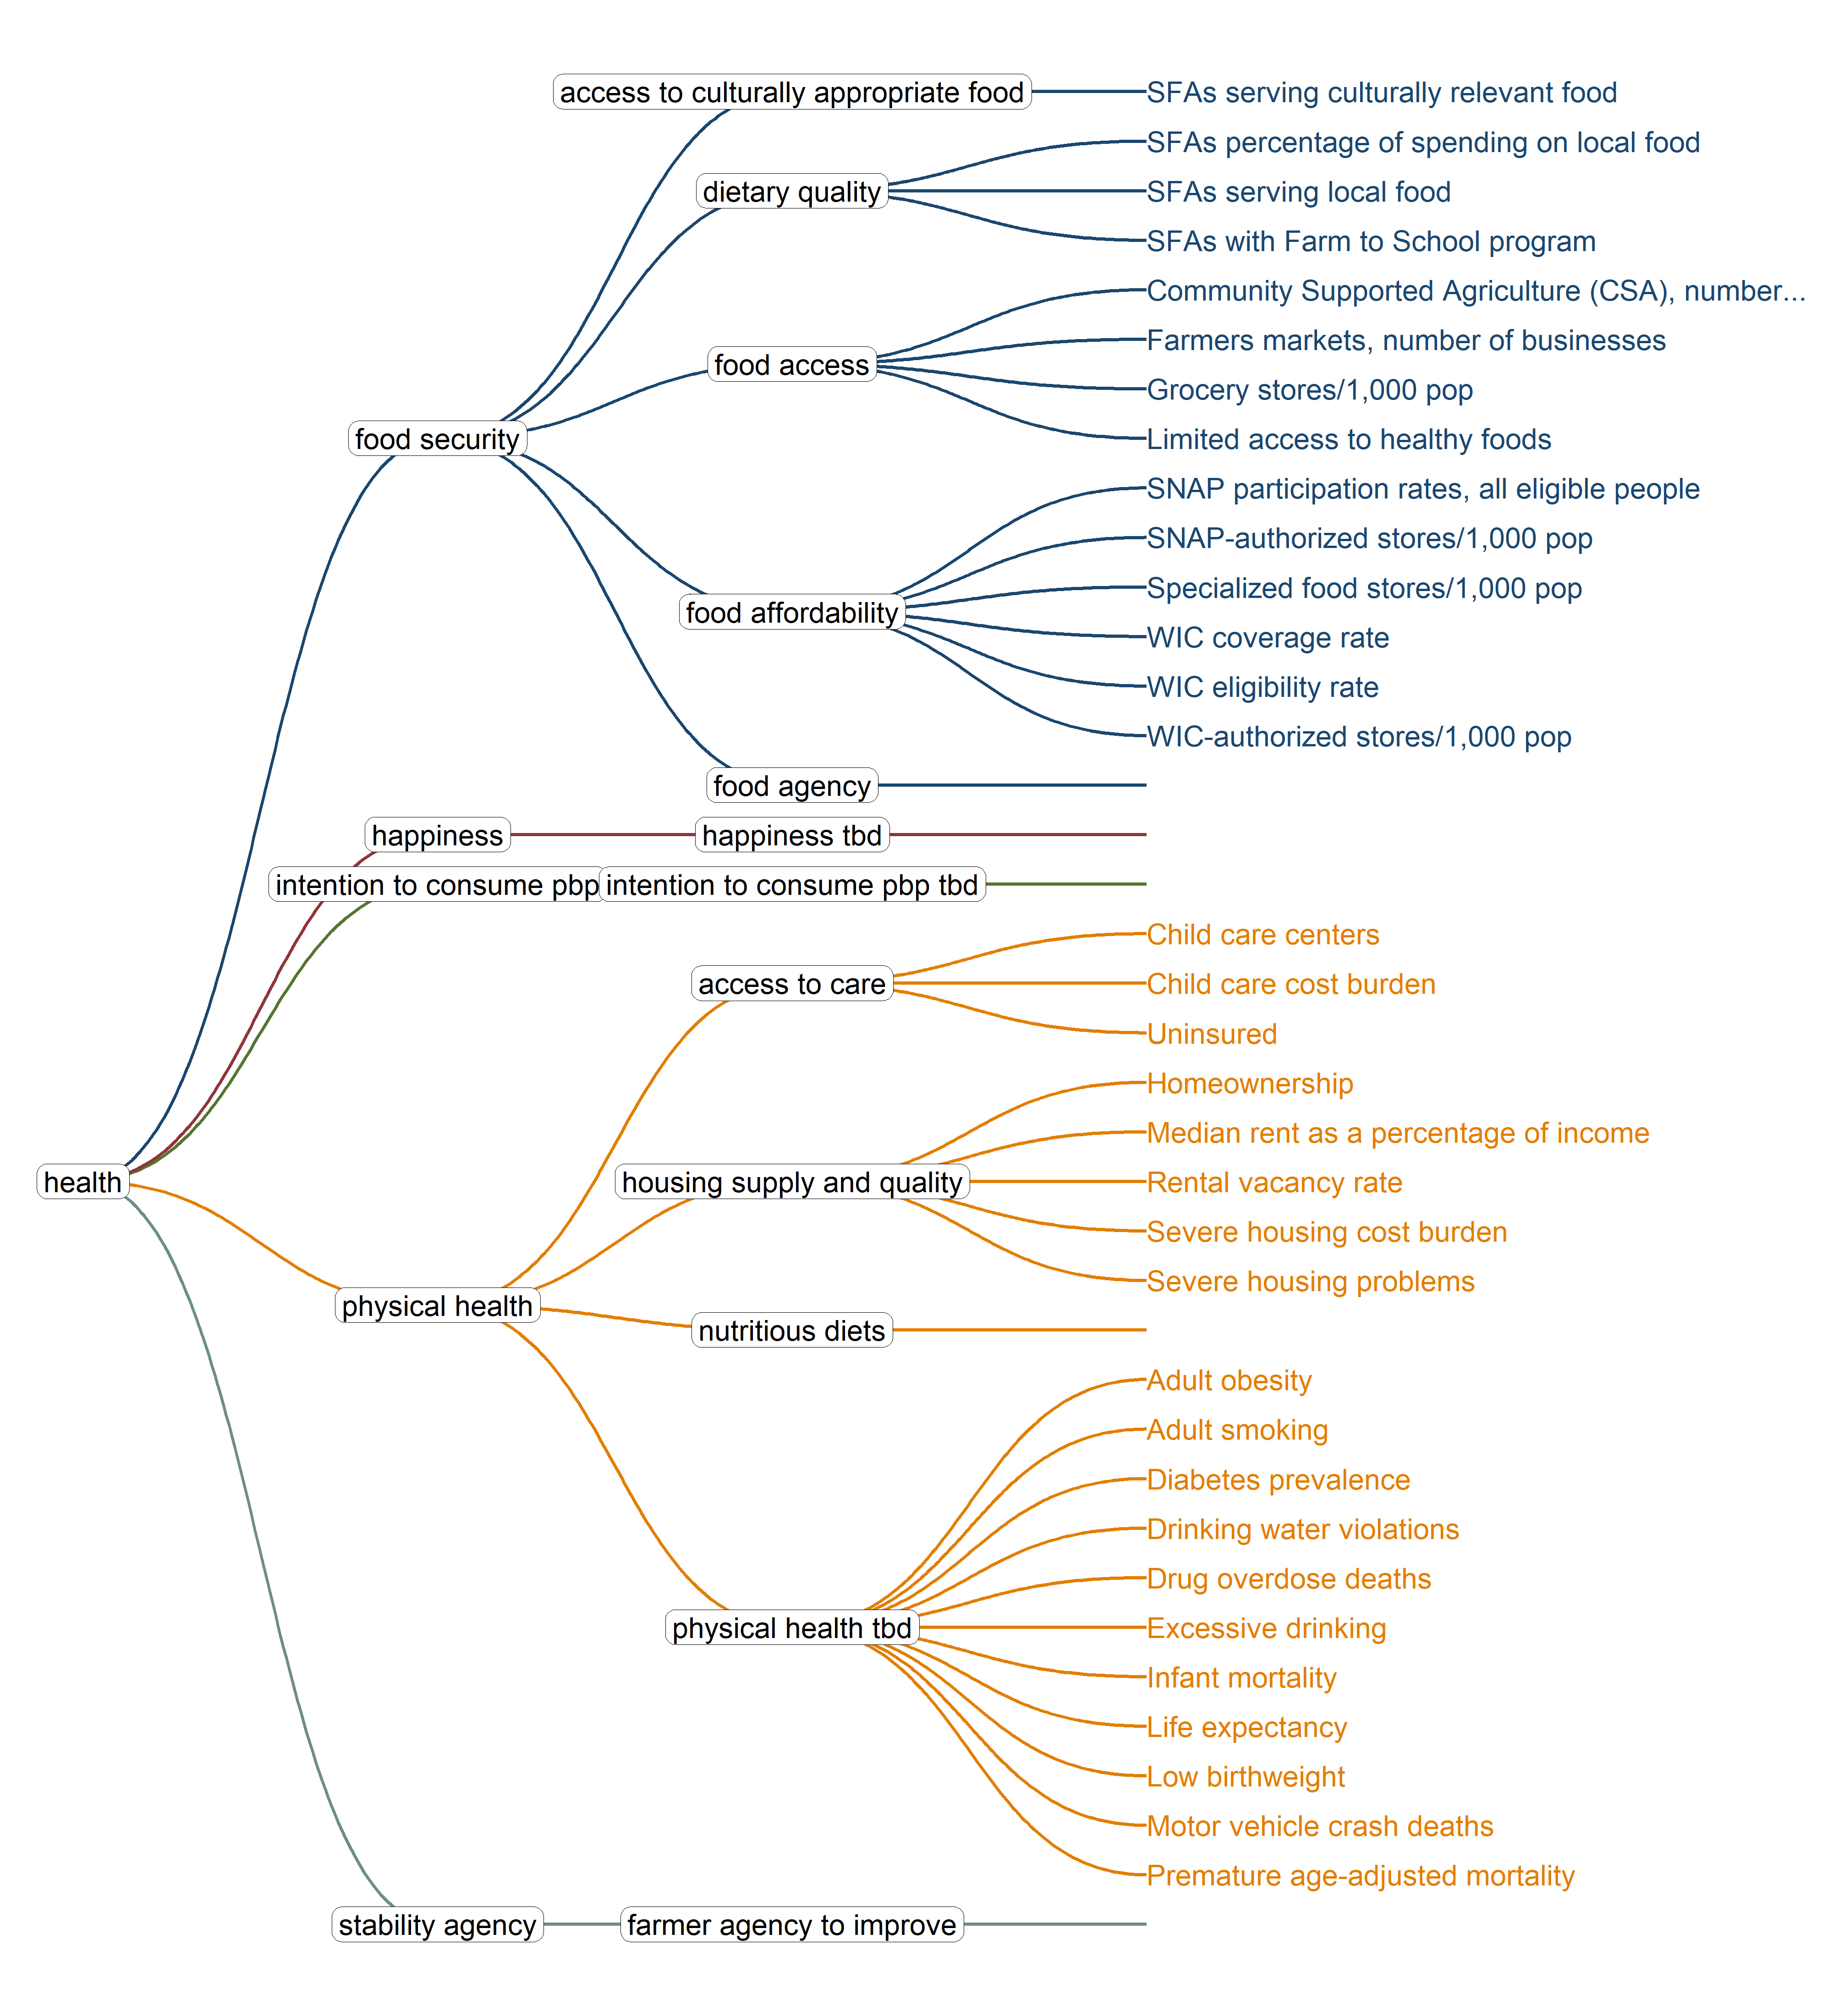
The Food Environment Atlas has lots of data on access and nutrition, which accounts for much of the food security data, along with NASS. I threw in a slew of metrics for physical health under the temporary indicator name ‘physical health tbd’ just to differentiate it from the index. I also have a handful of established composite indices for health, including the UW County Health Rankings metrics for health factors (behavior, clinical care, social and economic factors, physical environment) and health outcomes (length of life, quality of life), as well as some established food security indices that are not included in this framework. I will instead use them to compare to dimensions scores as external validation in the Validation section.
The social dimension is admittedly slim, but it could have been worse. The County Health Rankings dataset brings a few useful metrics here, like social associations and disconnected youth. Voter turnout is a proxy for participatory governance in food systems - I can’t imagine finding something much more specific than that at this point. I also need to replace mean producer age with a diversity index for producer age groups from NASS.
Code
plots$social <-get_dimension_ggraph(framework_df = frame,dimension_in ='social',include_metrics =TRUE,y_limits =c(-1.7, 3),palette ="scico::batlowW")# Save list of plots for preso# saveRDS(plots, 'preso/plots/frameworks.rds')plots$social
2 Table
Here is a table with just the dimensions, indices, and indicators from the framework. The button on the left will download all dimensions, or a subset if you have filtered the table below. The button on the right will download a static file containing the 23 indicators referenced in the RFPP.
1.5 Social
The social dimension is admittedly slim, but it could have been worse. The County Health Rankings dataset brings a few useful metrics here, like social associations and disconnected youth. Voter turnout is a proxy for participatory governance in food systems - I can’t imagine finding something much more specific than that at this point. I also need to replace mean producer age with a diversity index for producer age groups from NASS.
Code