Here you can find the current set (as of 2025-07-21) of indicators along with their indices and dimensions. This reflects the indicator refinement meetings that consolidated the economics, environment, and production dimensions, but no such process has taken place with health and social yet.
1 Indicator Table
The table below lets you search and filter through the indicators. Use the button to download the current set, including any filters you might have applied.
Code
# Clean up treetree <- SMdata::fixed_tree %>%select(dimension, index, indicator) %>%unique() %>%arrange(dimension, index, indicator)# Remove tbd from pbp indicator# Then remove all other indicators that end with tbd (placeholders)tree <- tree %>%mutate(indicator =case_when(str_detect(indicator, '^intention.*tbd$') ~str_remove(indicator, ' tbd'),.default = indicator ) ) %>%filter(str_detect(indicator, ' tbd$', negate =TRUE))# Formattingtree <- tree %>%# setNames(c(names(.) %>% snakecase::to_title_case())) %>% mutate(across(everything(), ~ snakecase::to_title_case(.x) %>%str_replace_all('tbd|Tbd', 'TBD') %>%str_replace_all('pbp|Pbp', 'PBP') %>%str_replace_all('e g', 'eg') %>%str_replace_all('Of Farm', 'Percentage of Farm') %>%str_replace_all('Carbon Ghg', 'Carbon, GHG,') %>%str_replace_all('Nimb Yism', 'Nimbyism') ) )# Add space buffer for graph treesgraph_tree <- tree %>%mutate(indicator =paste0(' ', indicator))# Names in title case for tabletable_tree <- tree %>%setNames(c(names(.) %>% snakecase::to_title_case()))# Make reactable table with download buttonhtmltools::browsable(tagList( tags$div(style ="display: flex; margin-bottom: 20px; justify-content: center;", tags$button(class ="btn btn-primary",style ="display: flex; align-items: center; gap: 8px; padding: 8px 12px;",tagList(fontawesome::fa("download"), "Download as CSV"),onclick ="Reactable.downloadDataCSV( 'indicator_table', 'indicator_framework.csv' )" ) ),get_reactable( table_tree,elementId ="indicator_table",columns =list(Dimension =colDef(minWidth =75),Index =colDef(minWidth =100),Indicator =colDef(minWidth =200) ) ) ))
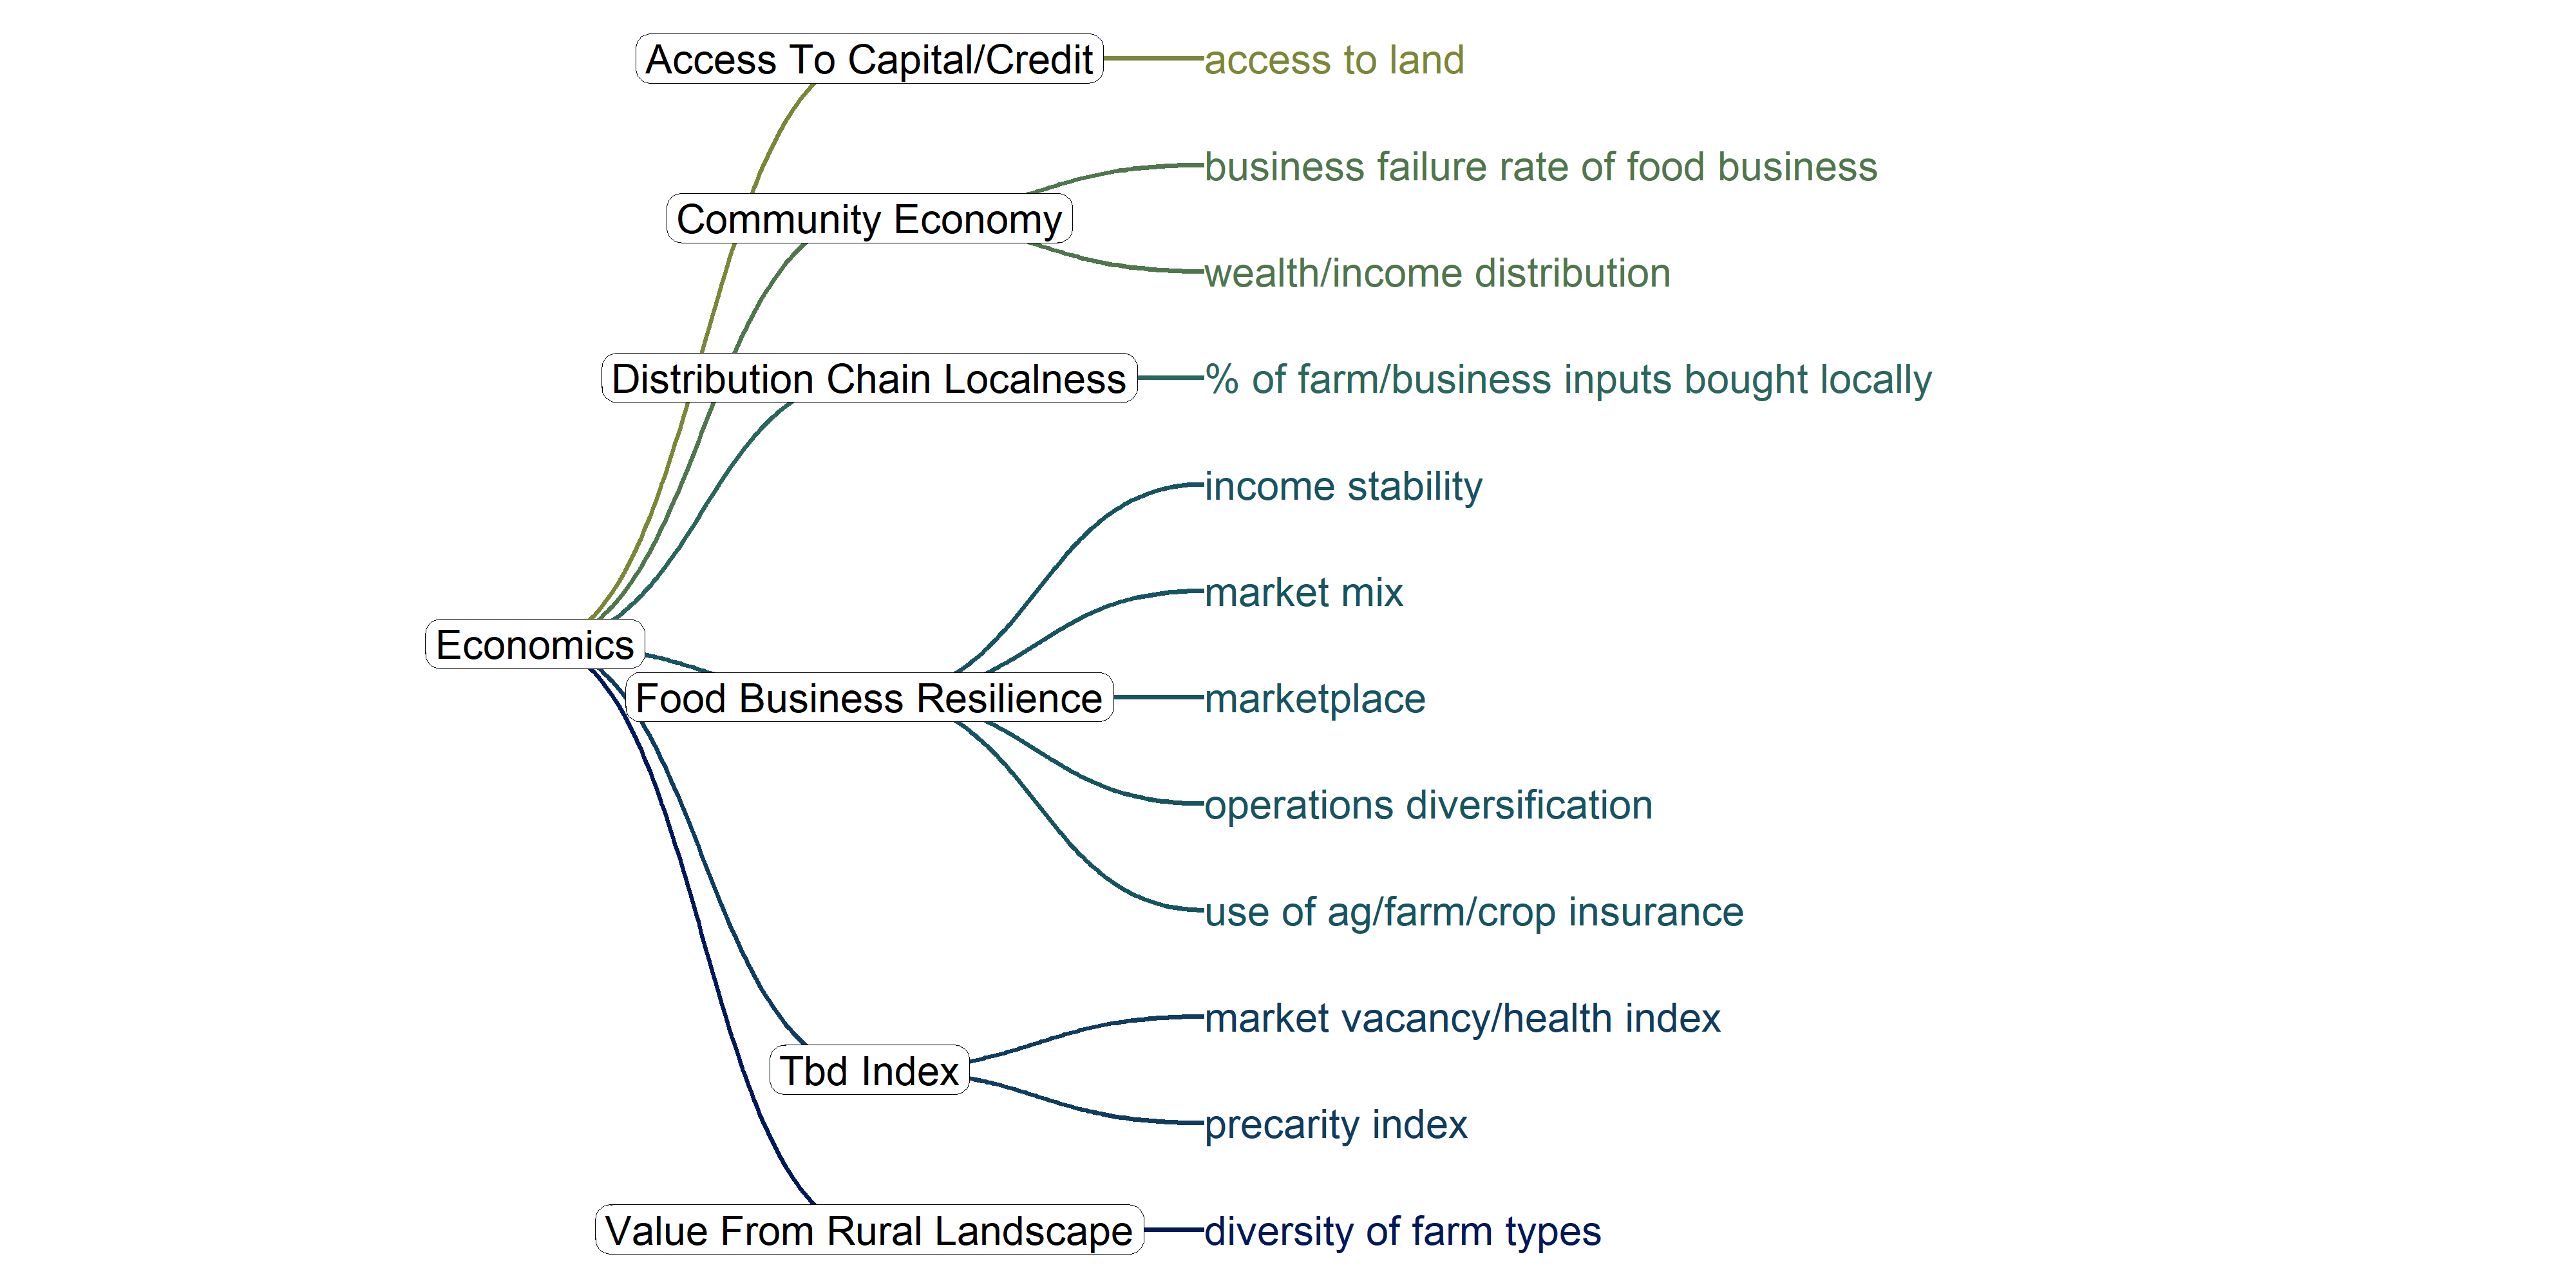
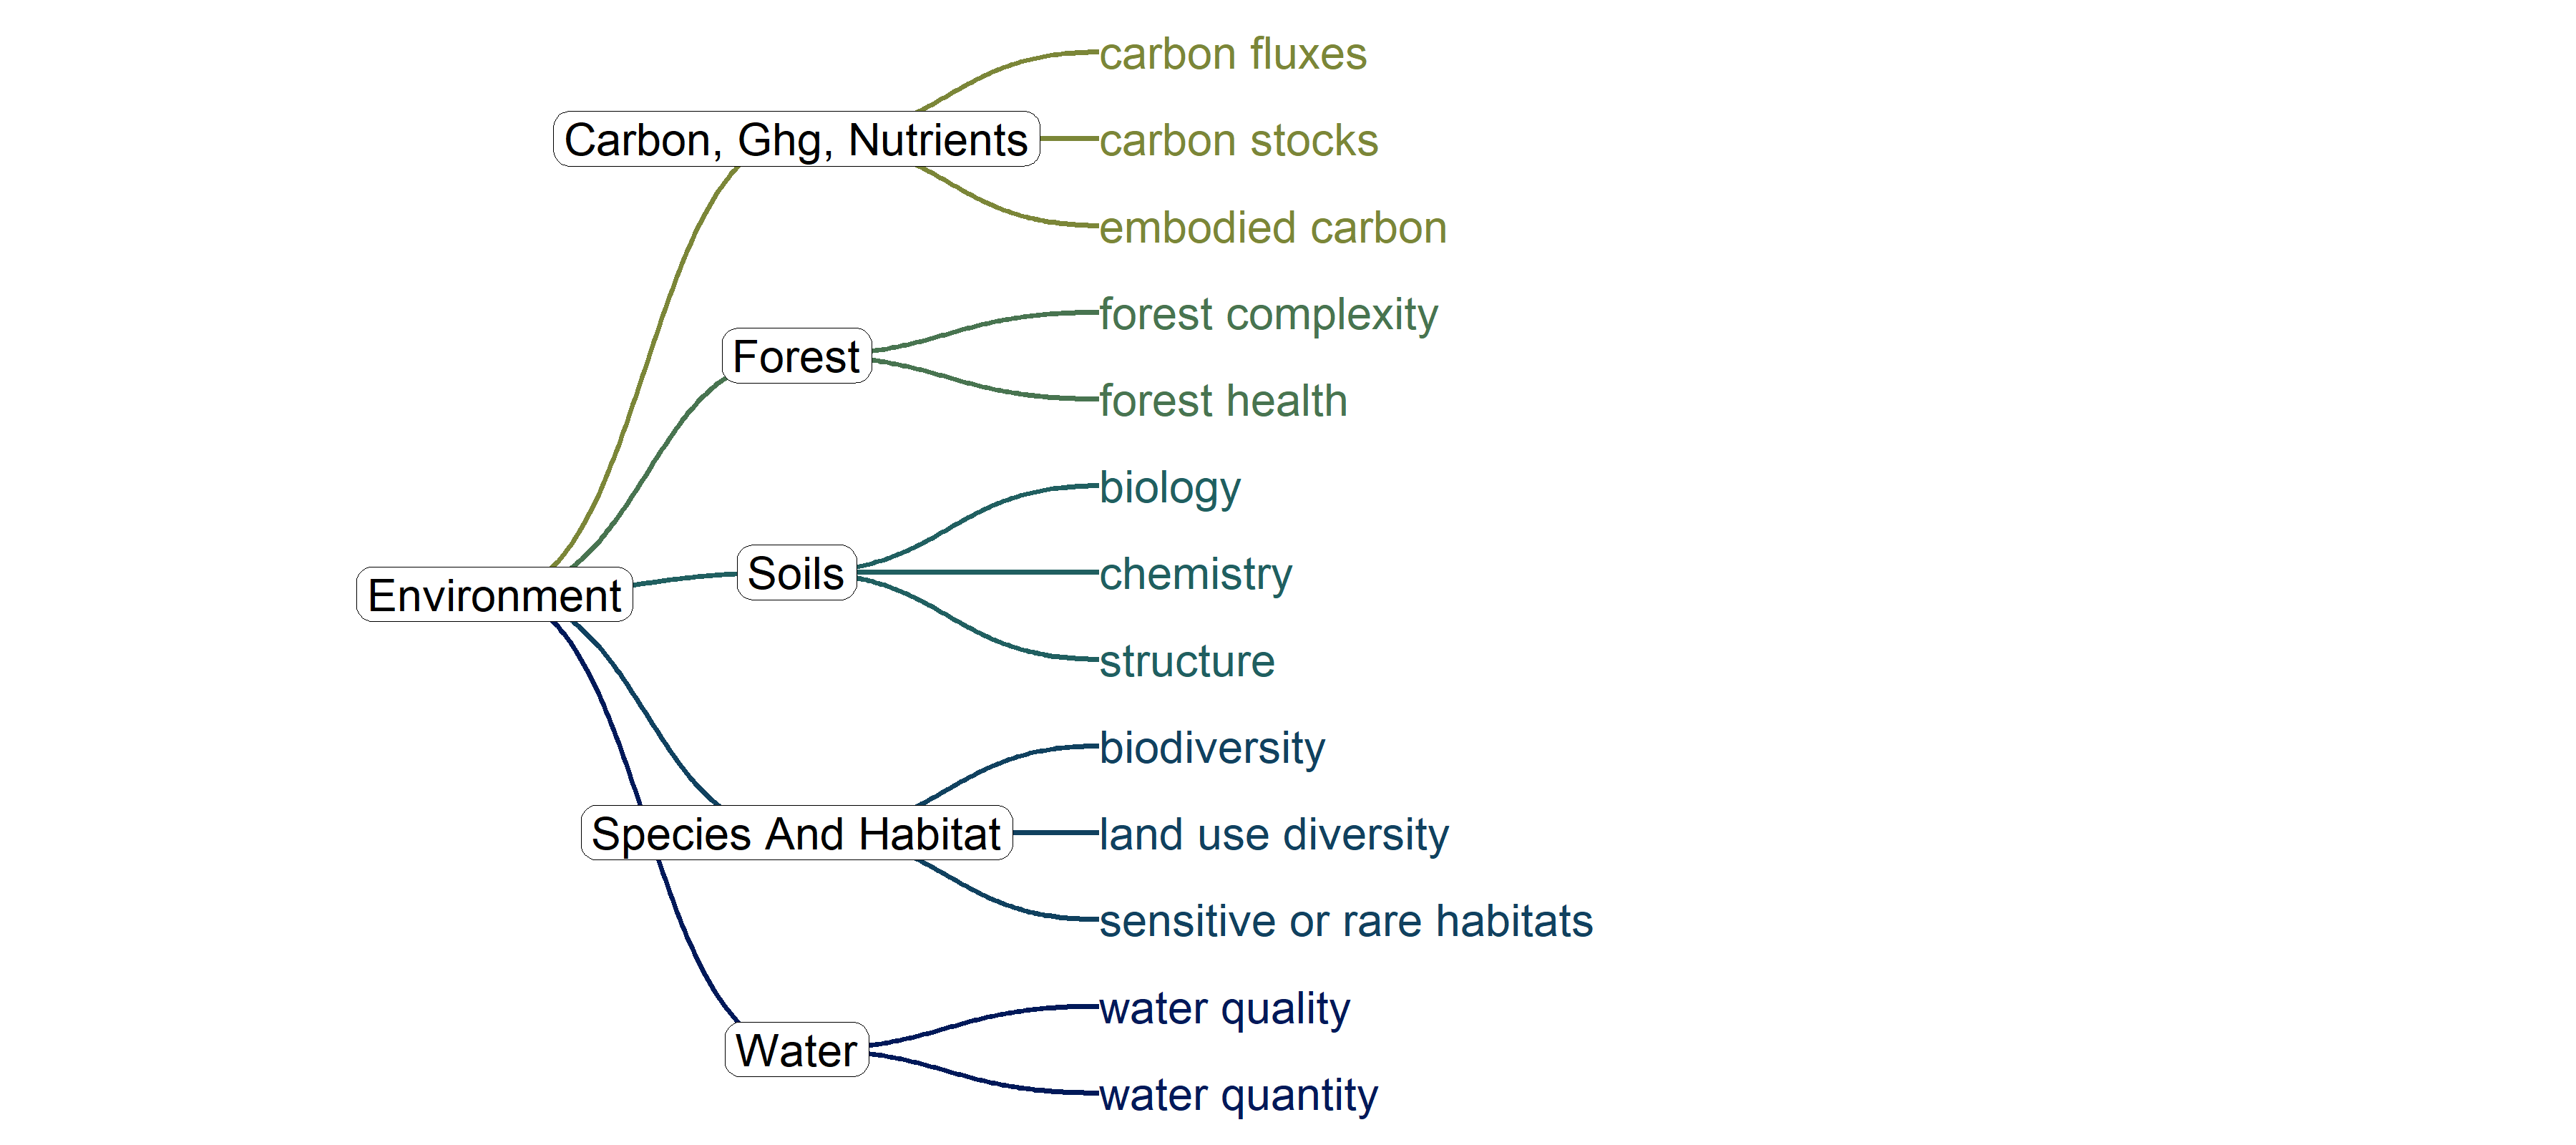
2 Dimension Graphs
Below are graphs showing the same information as in the table. From left to right are the dimensions, indices, and indicators.
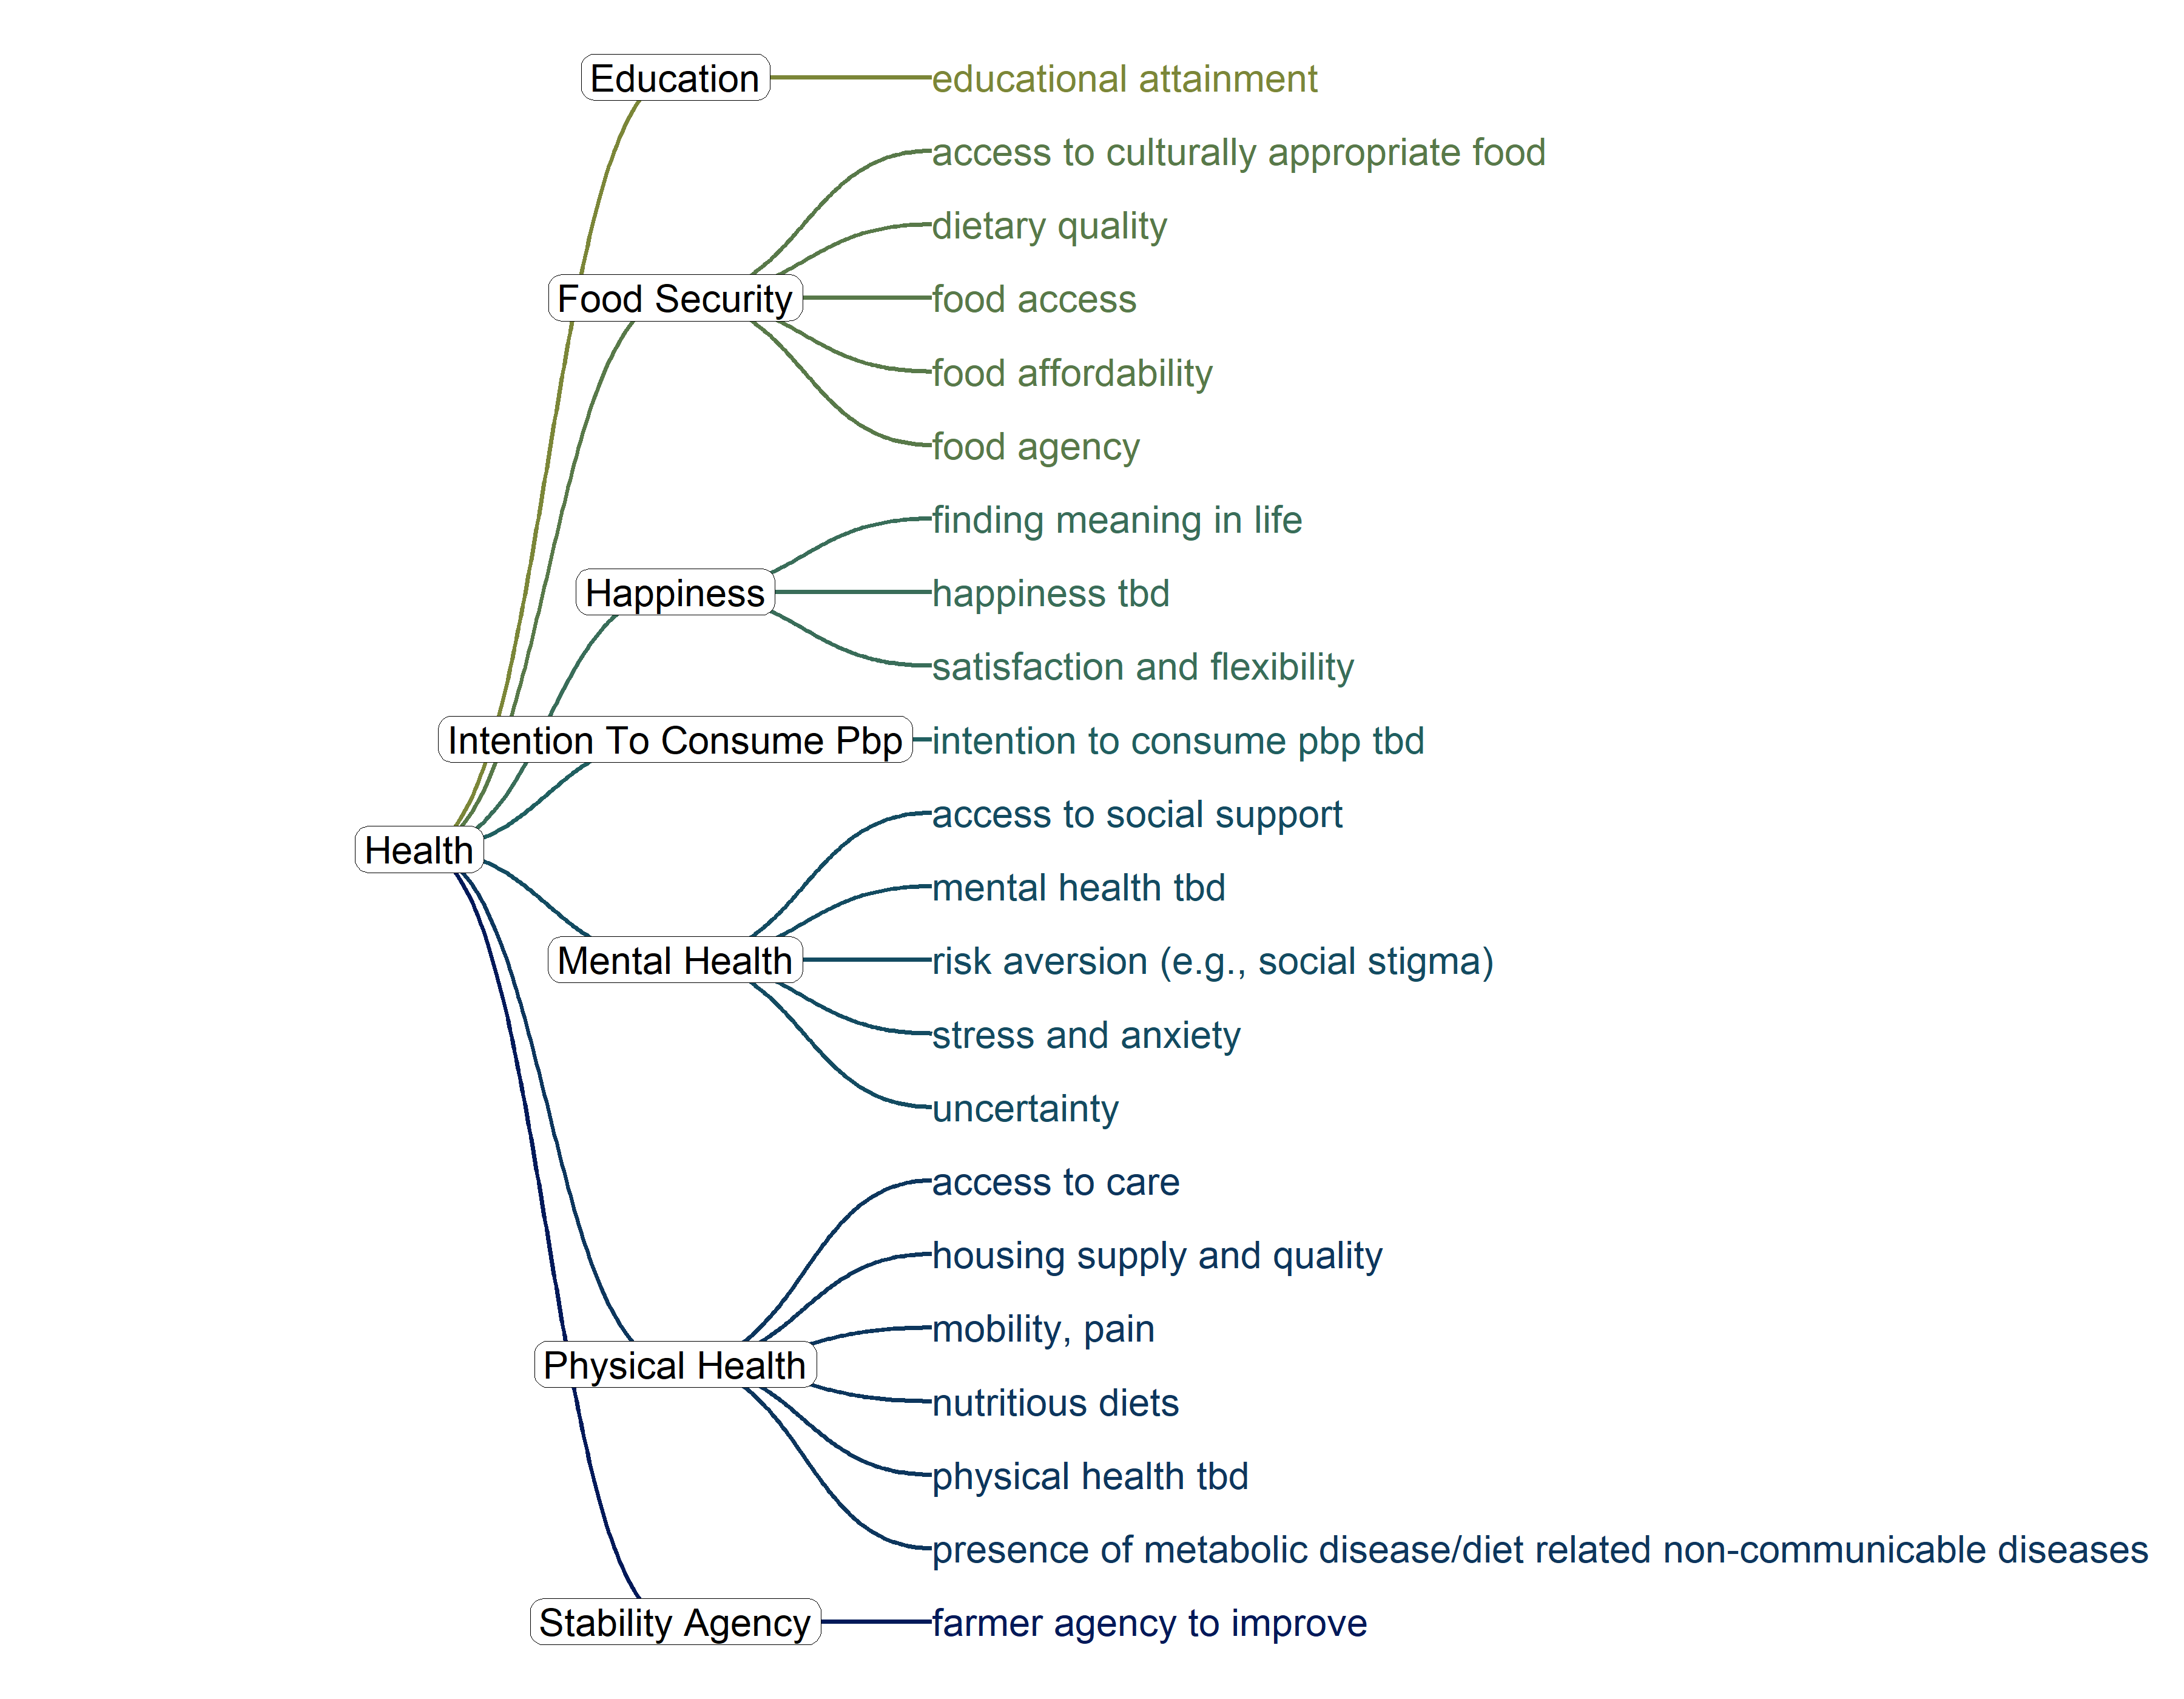

2.5 Social
Code