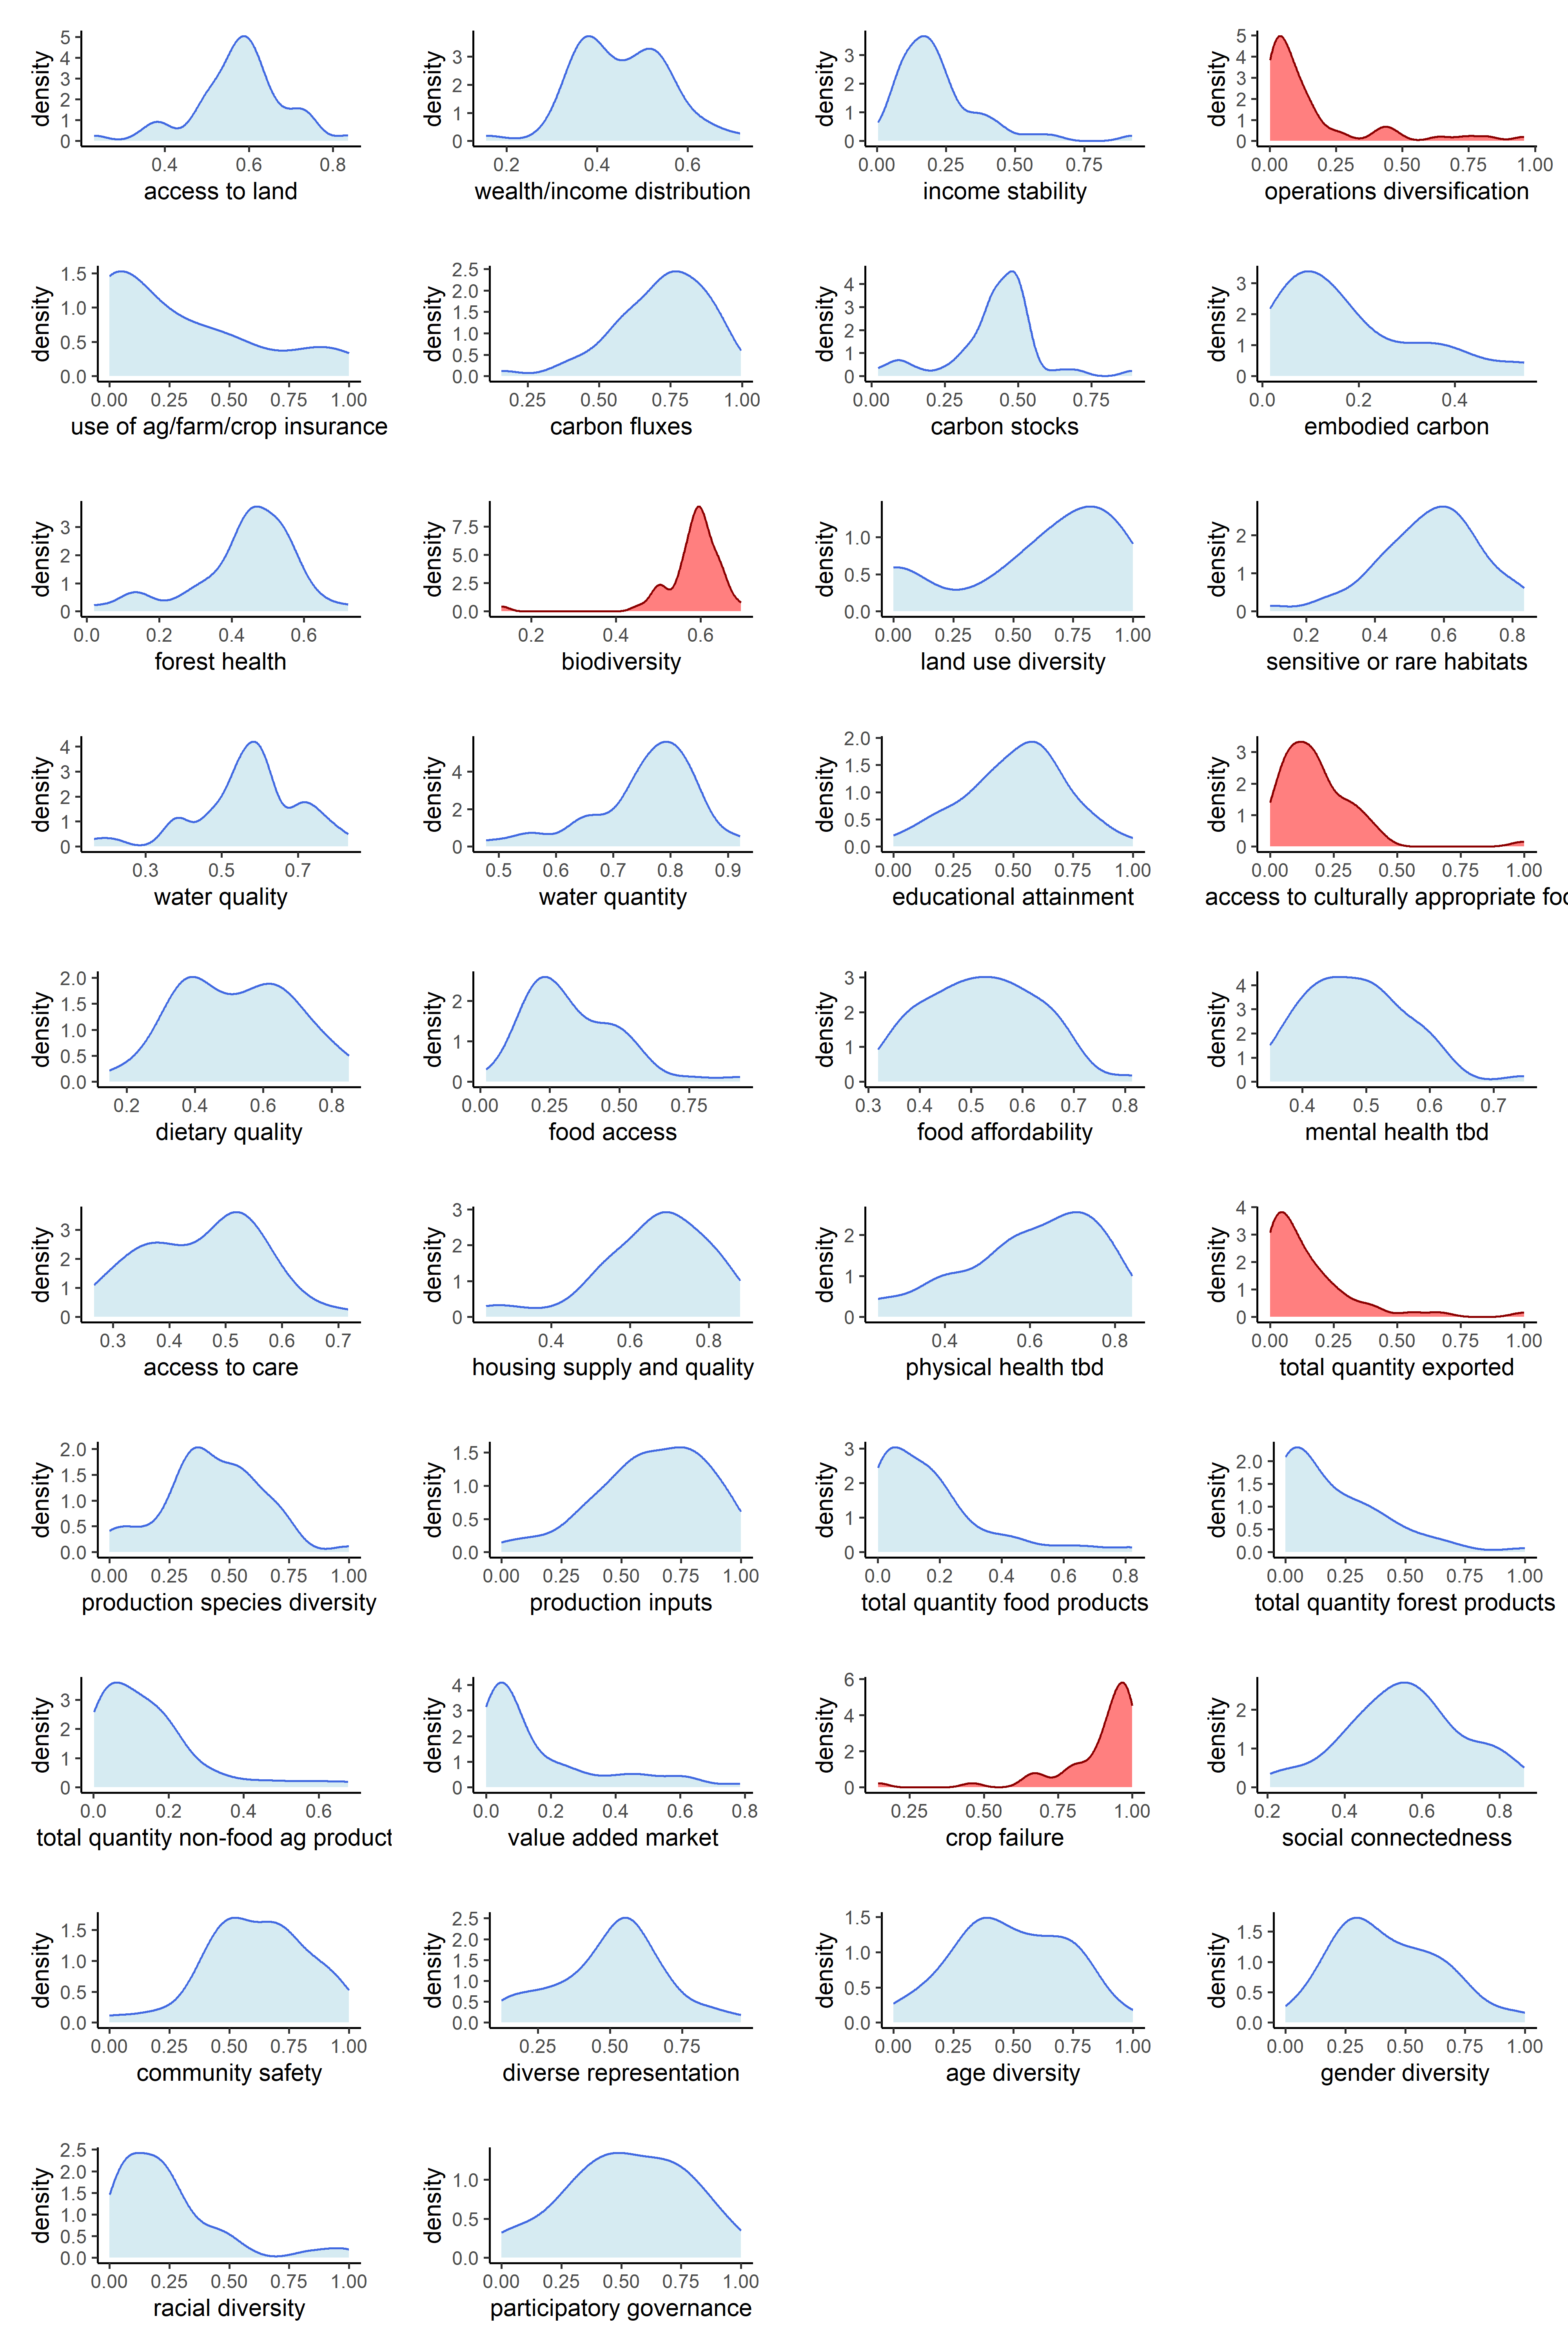
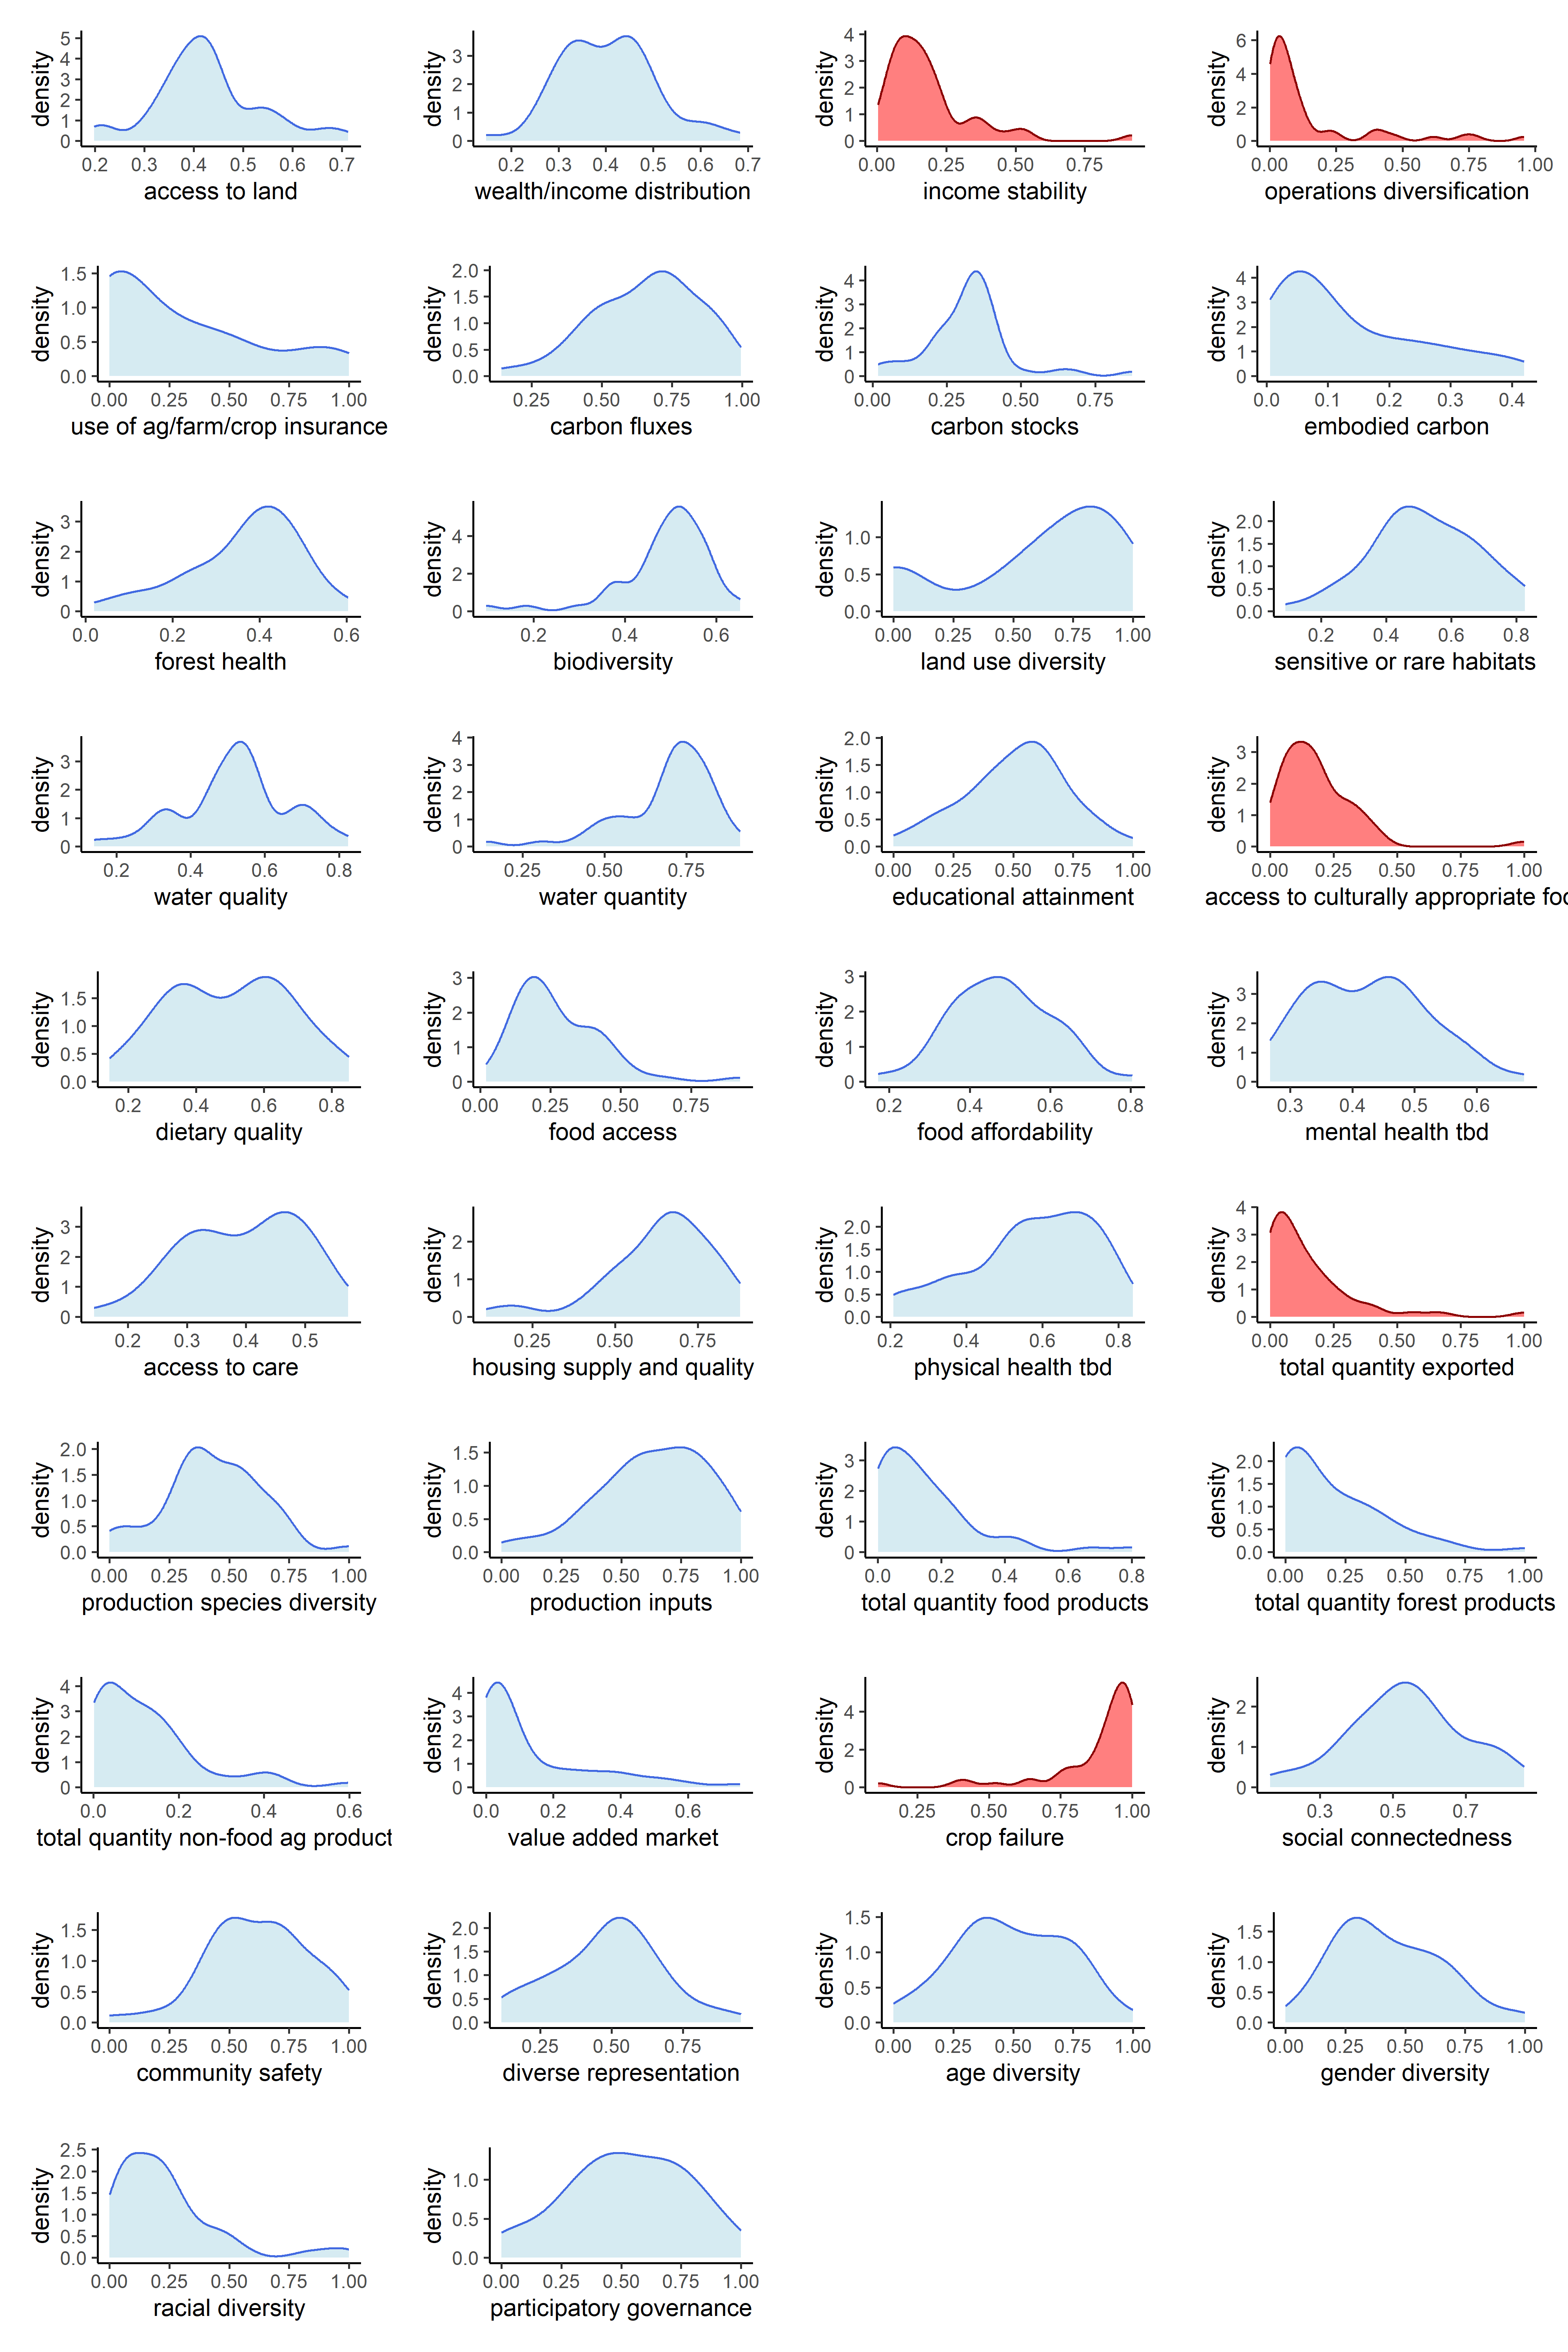
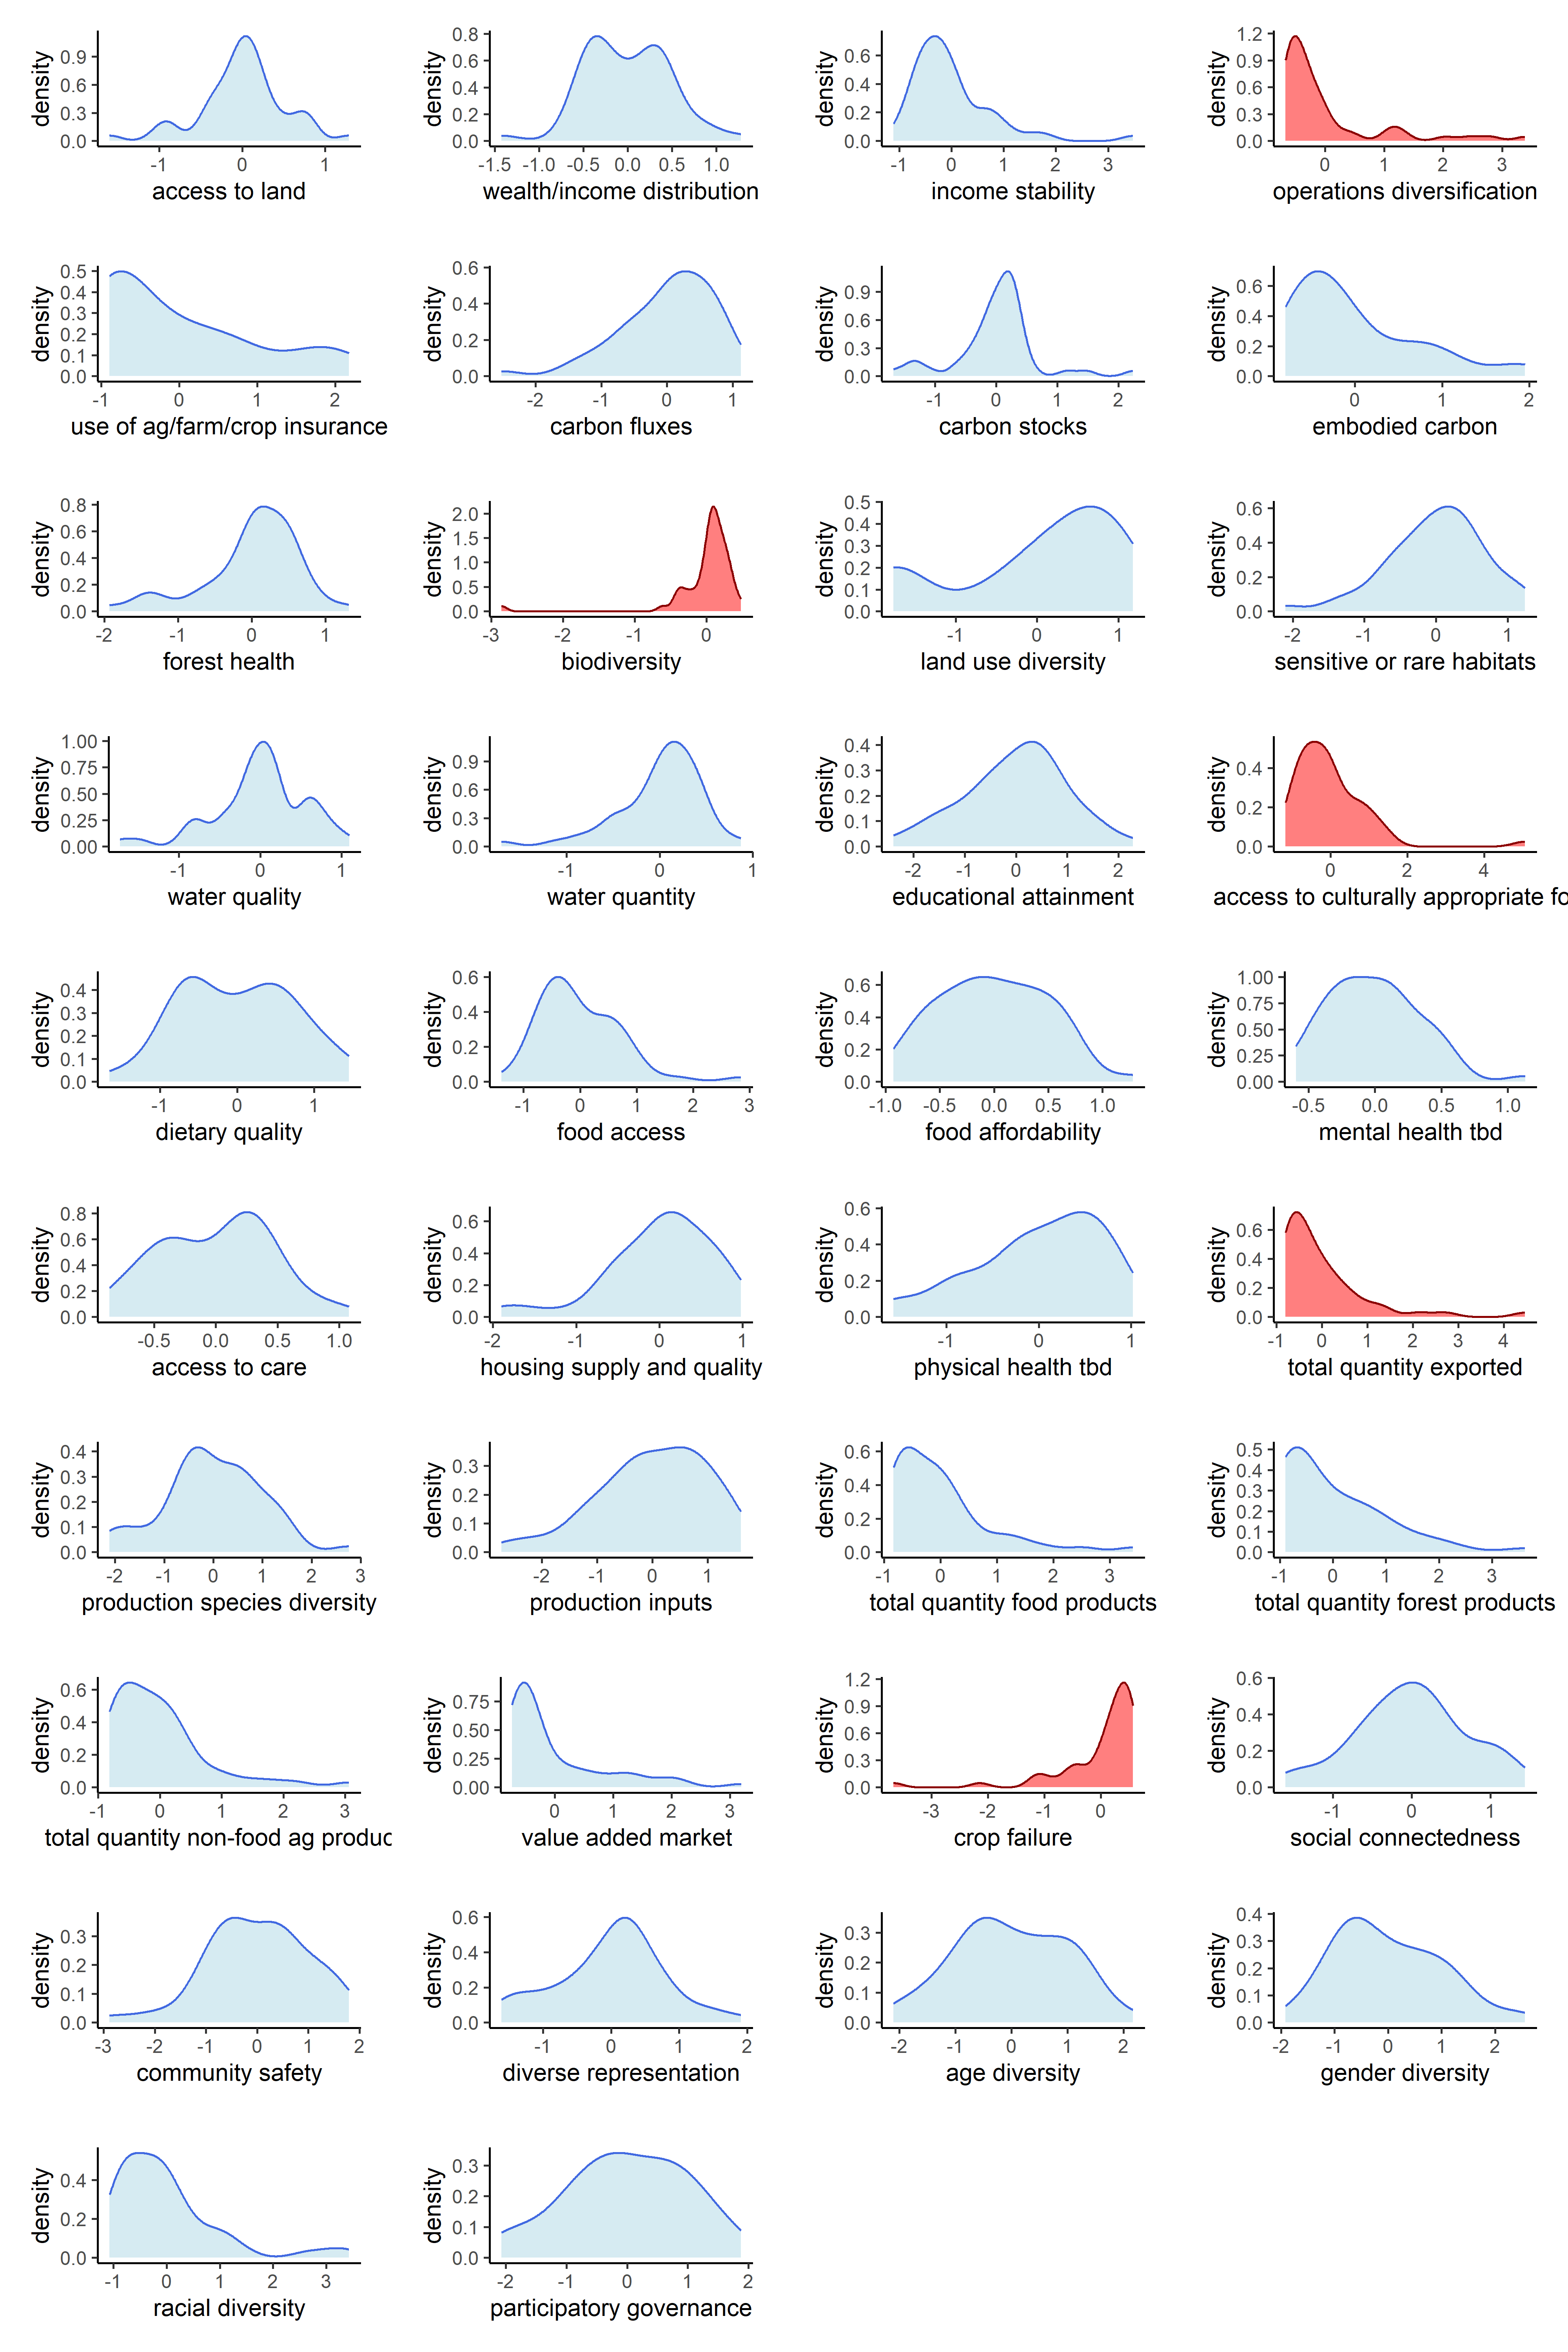
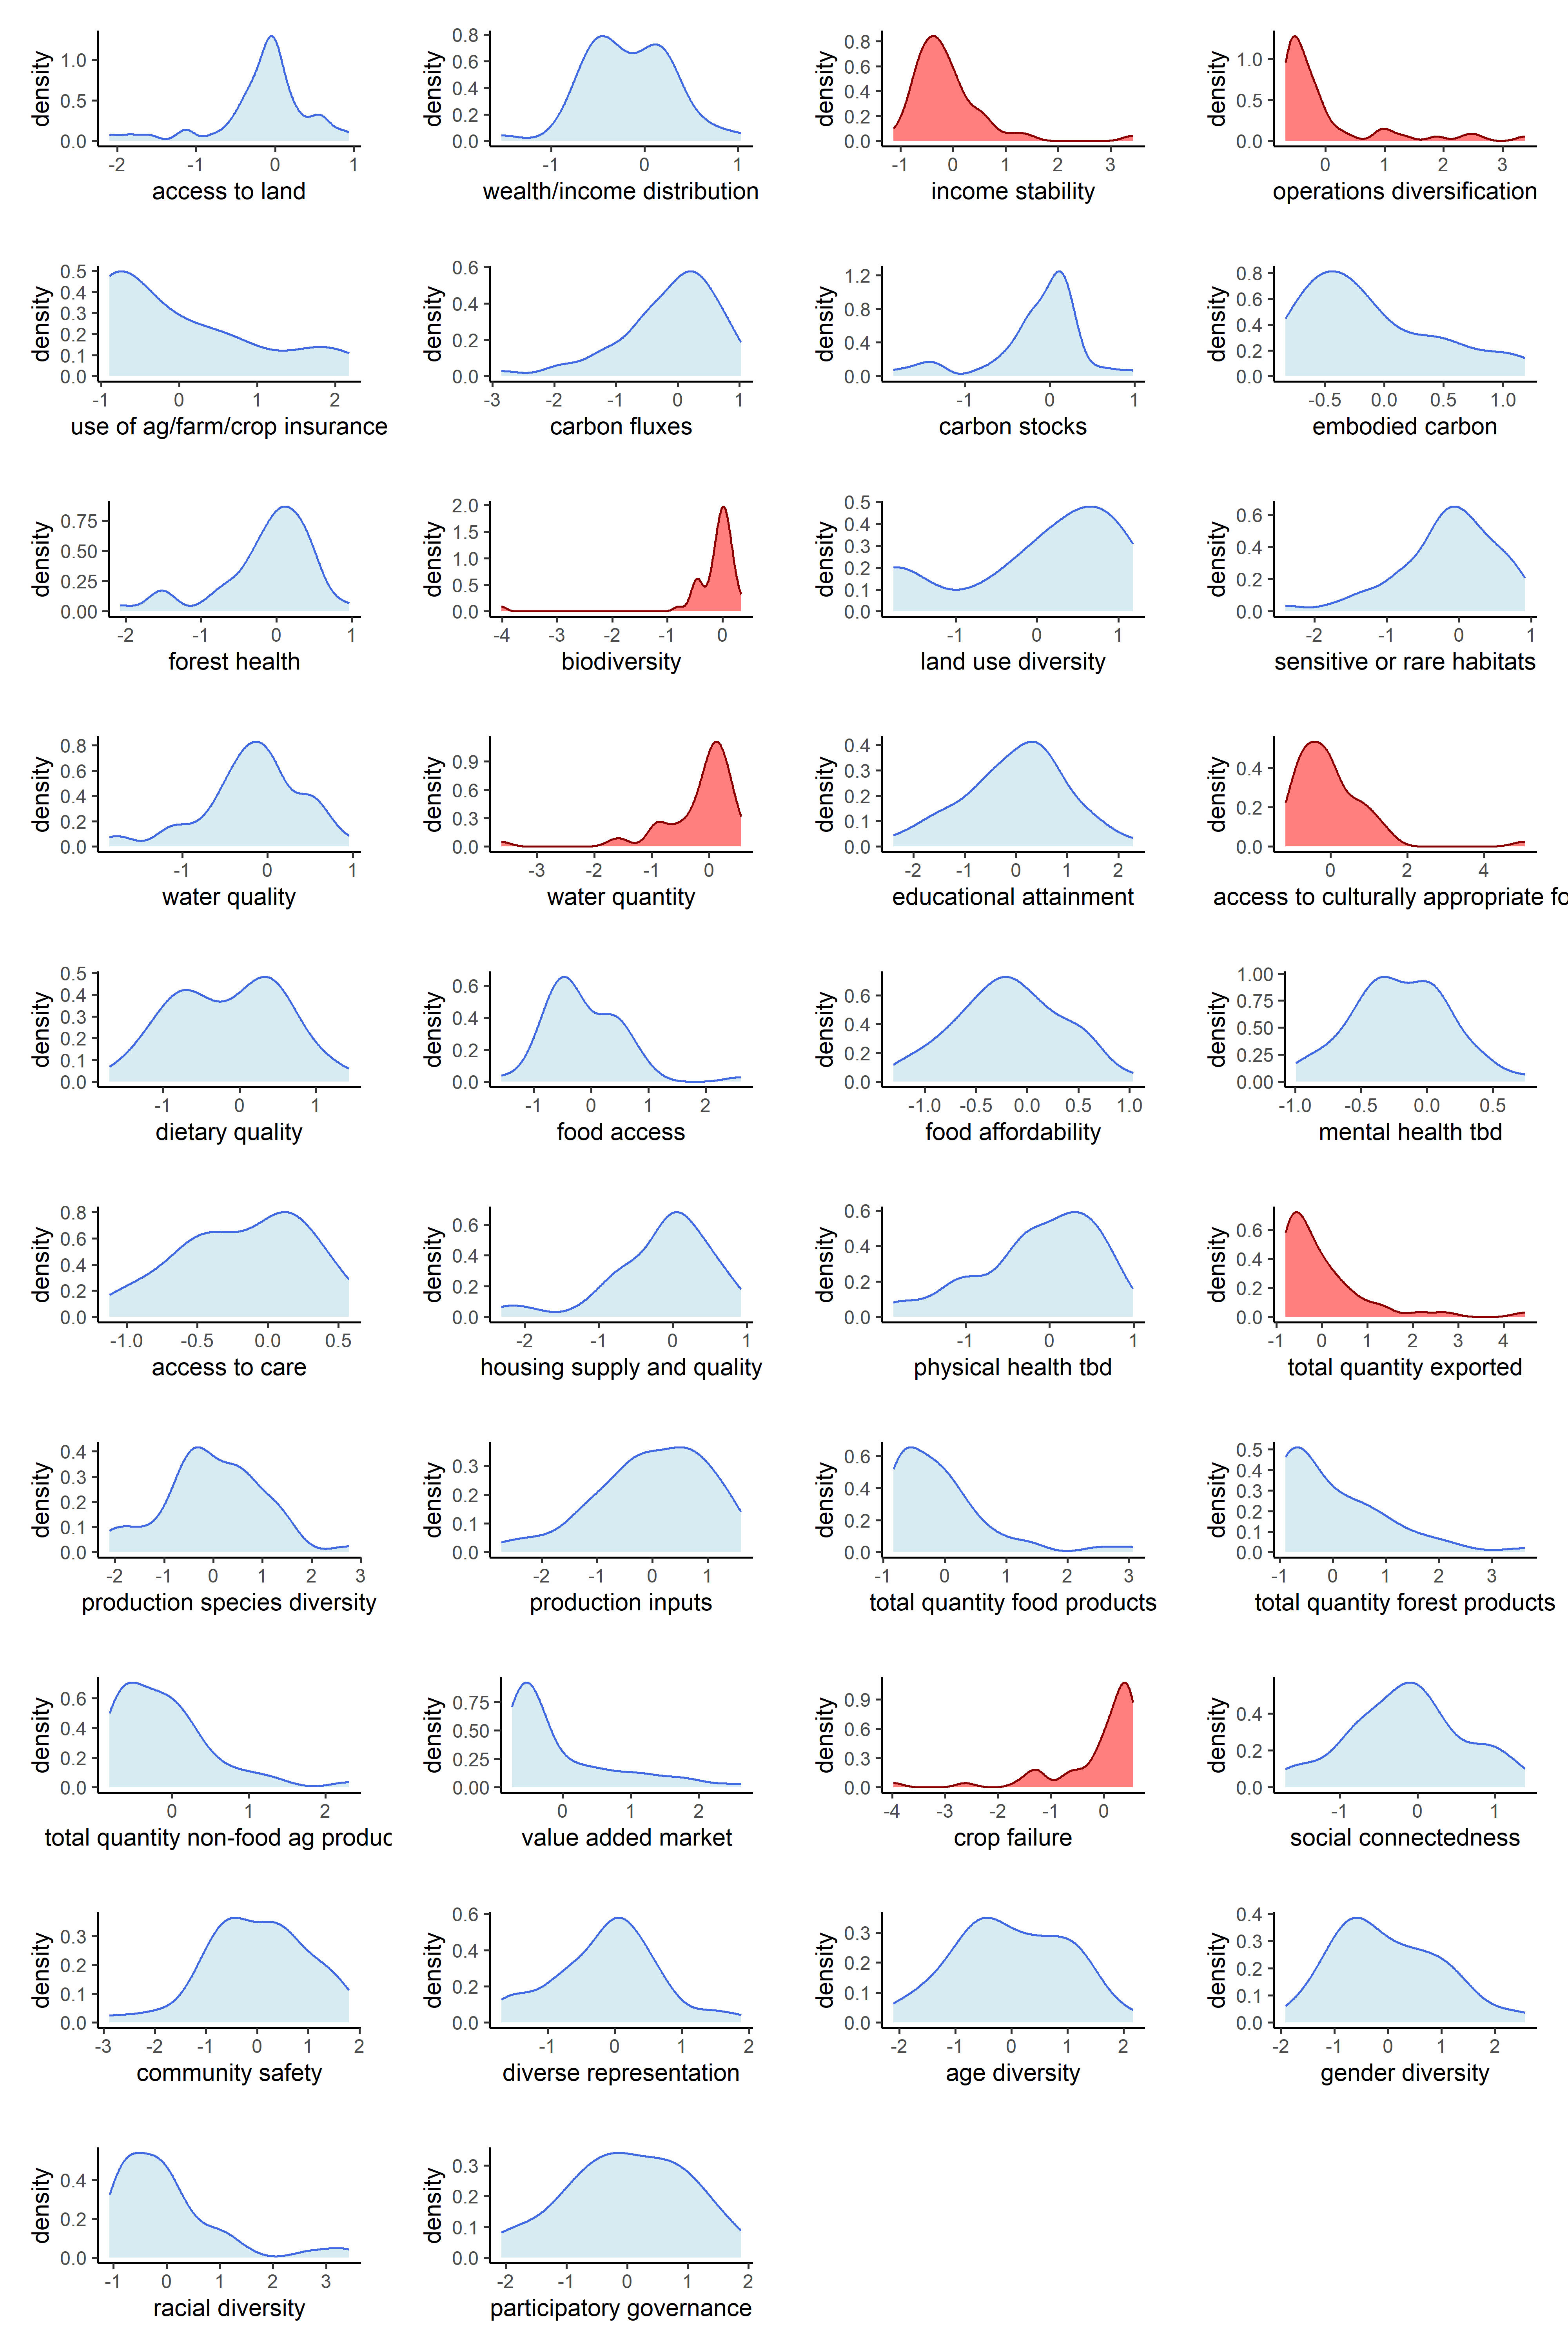
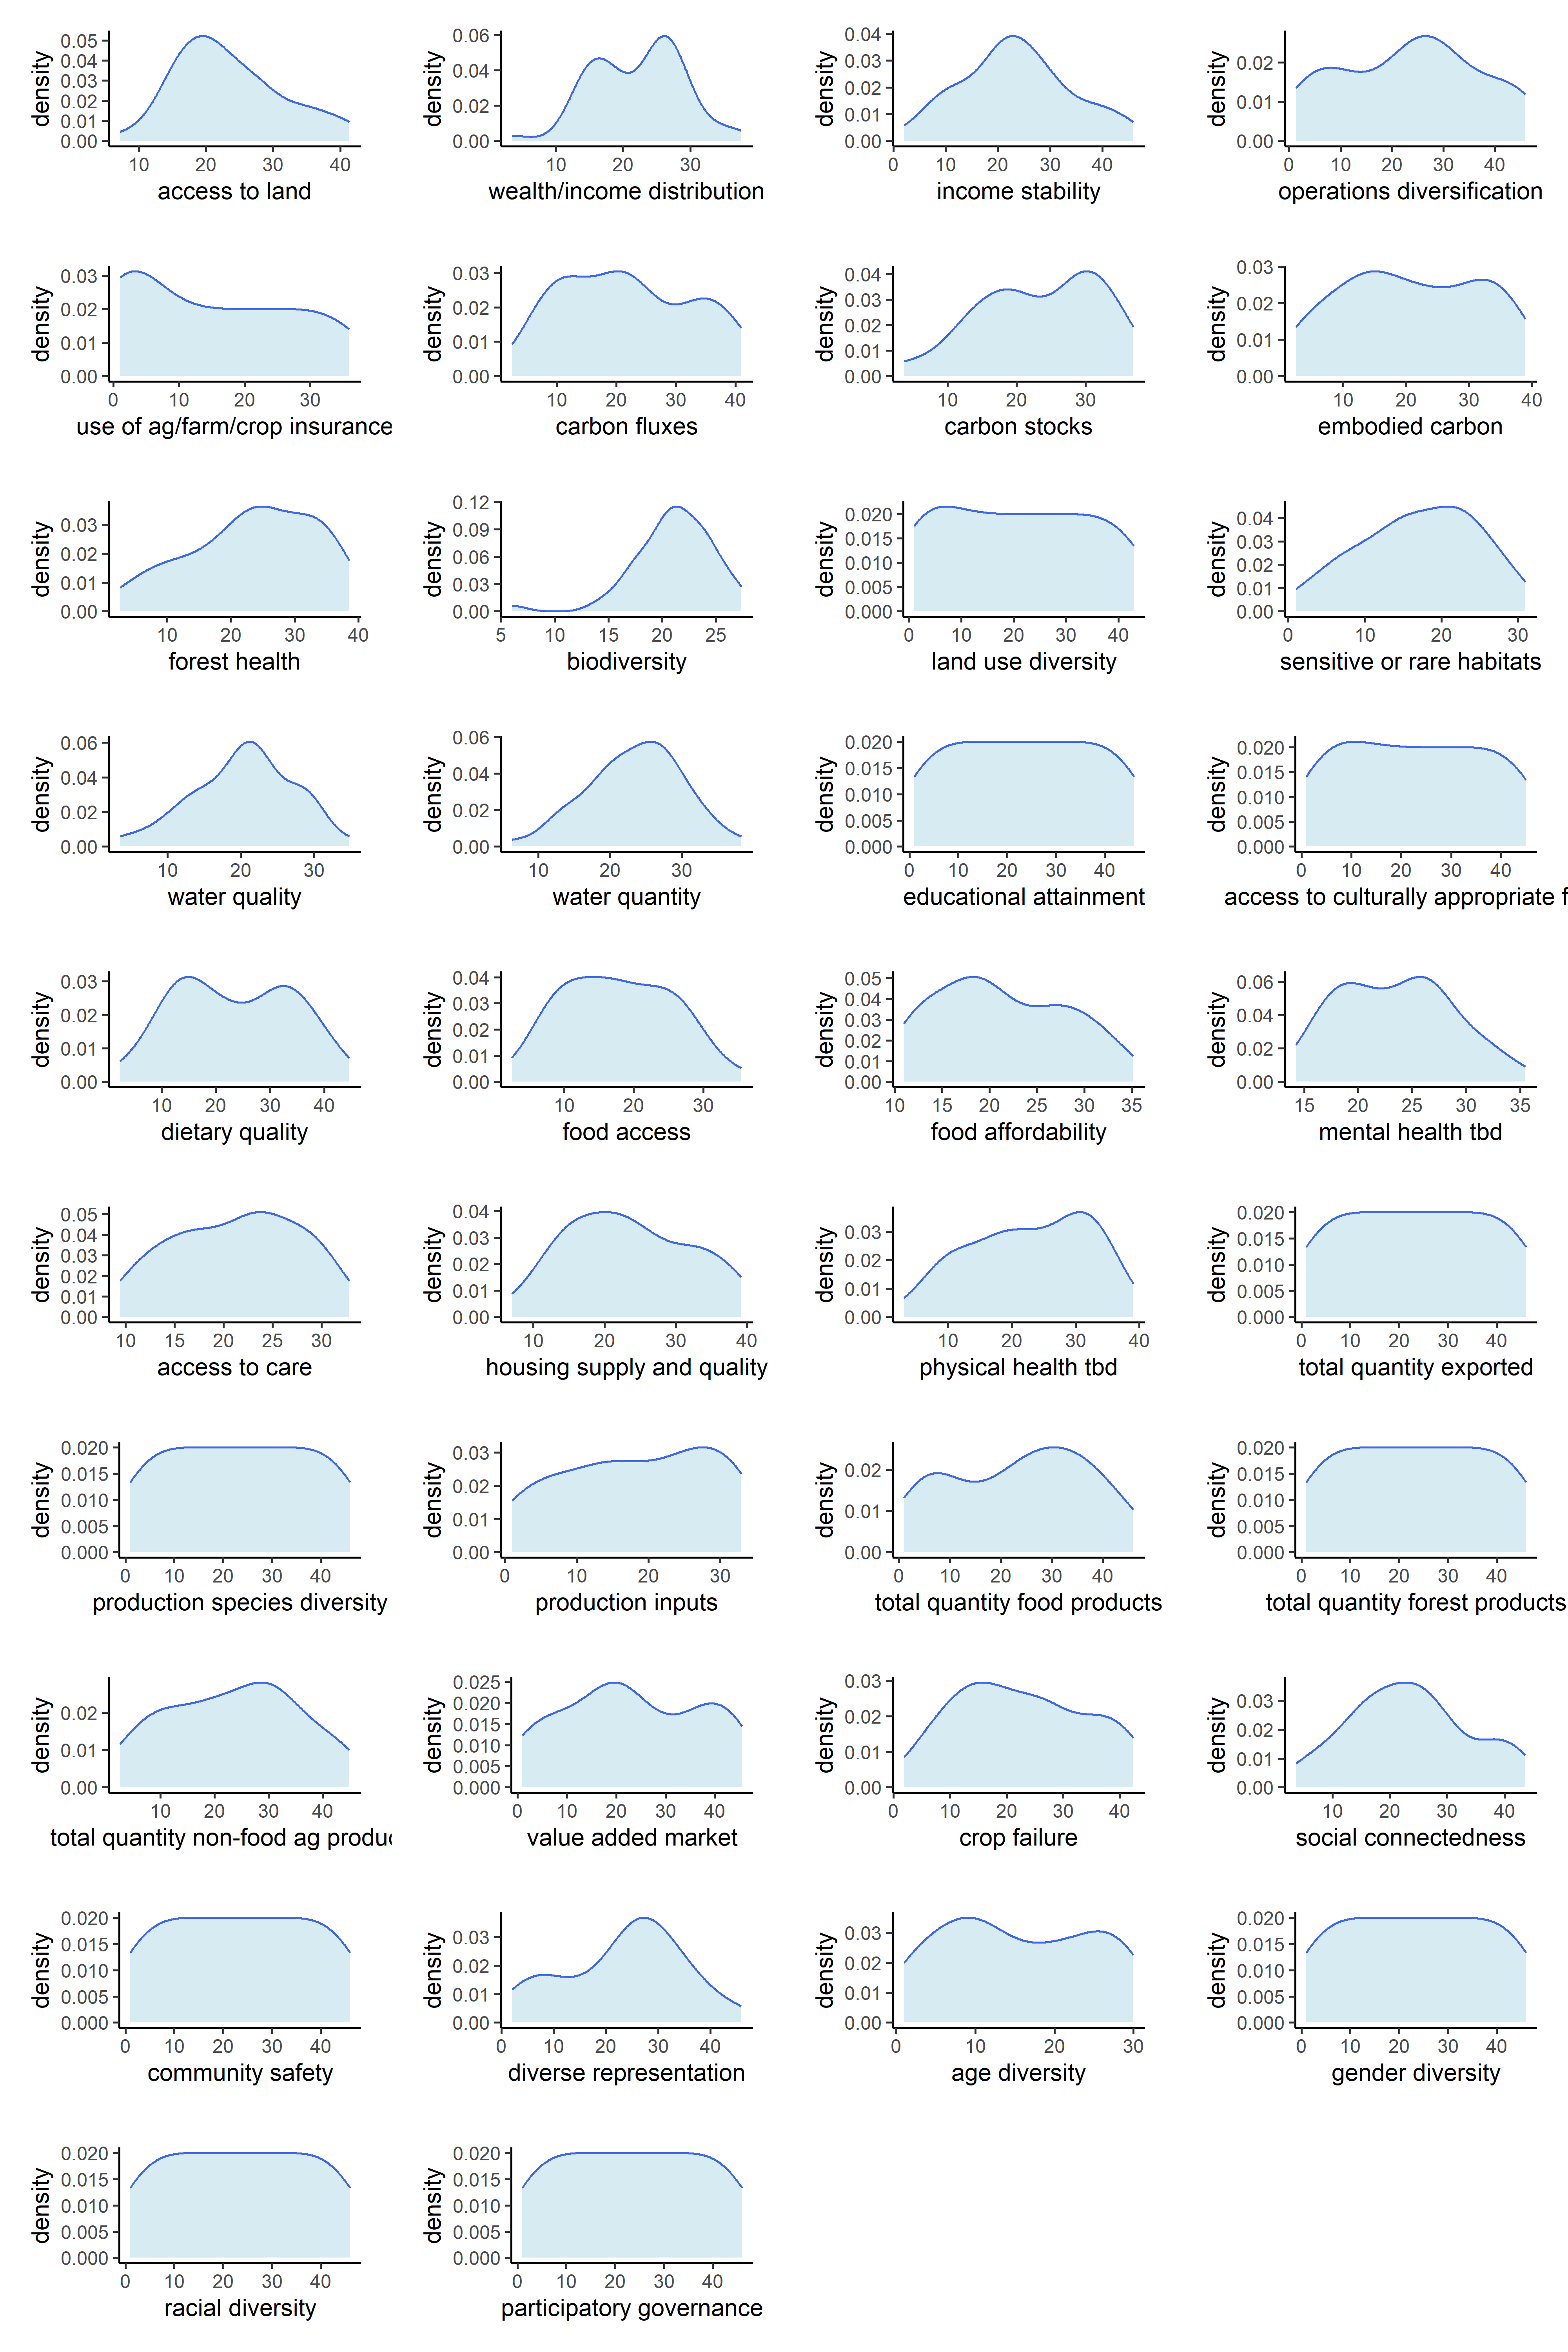
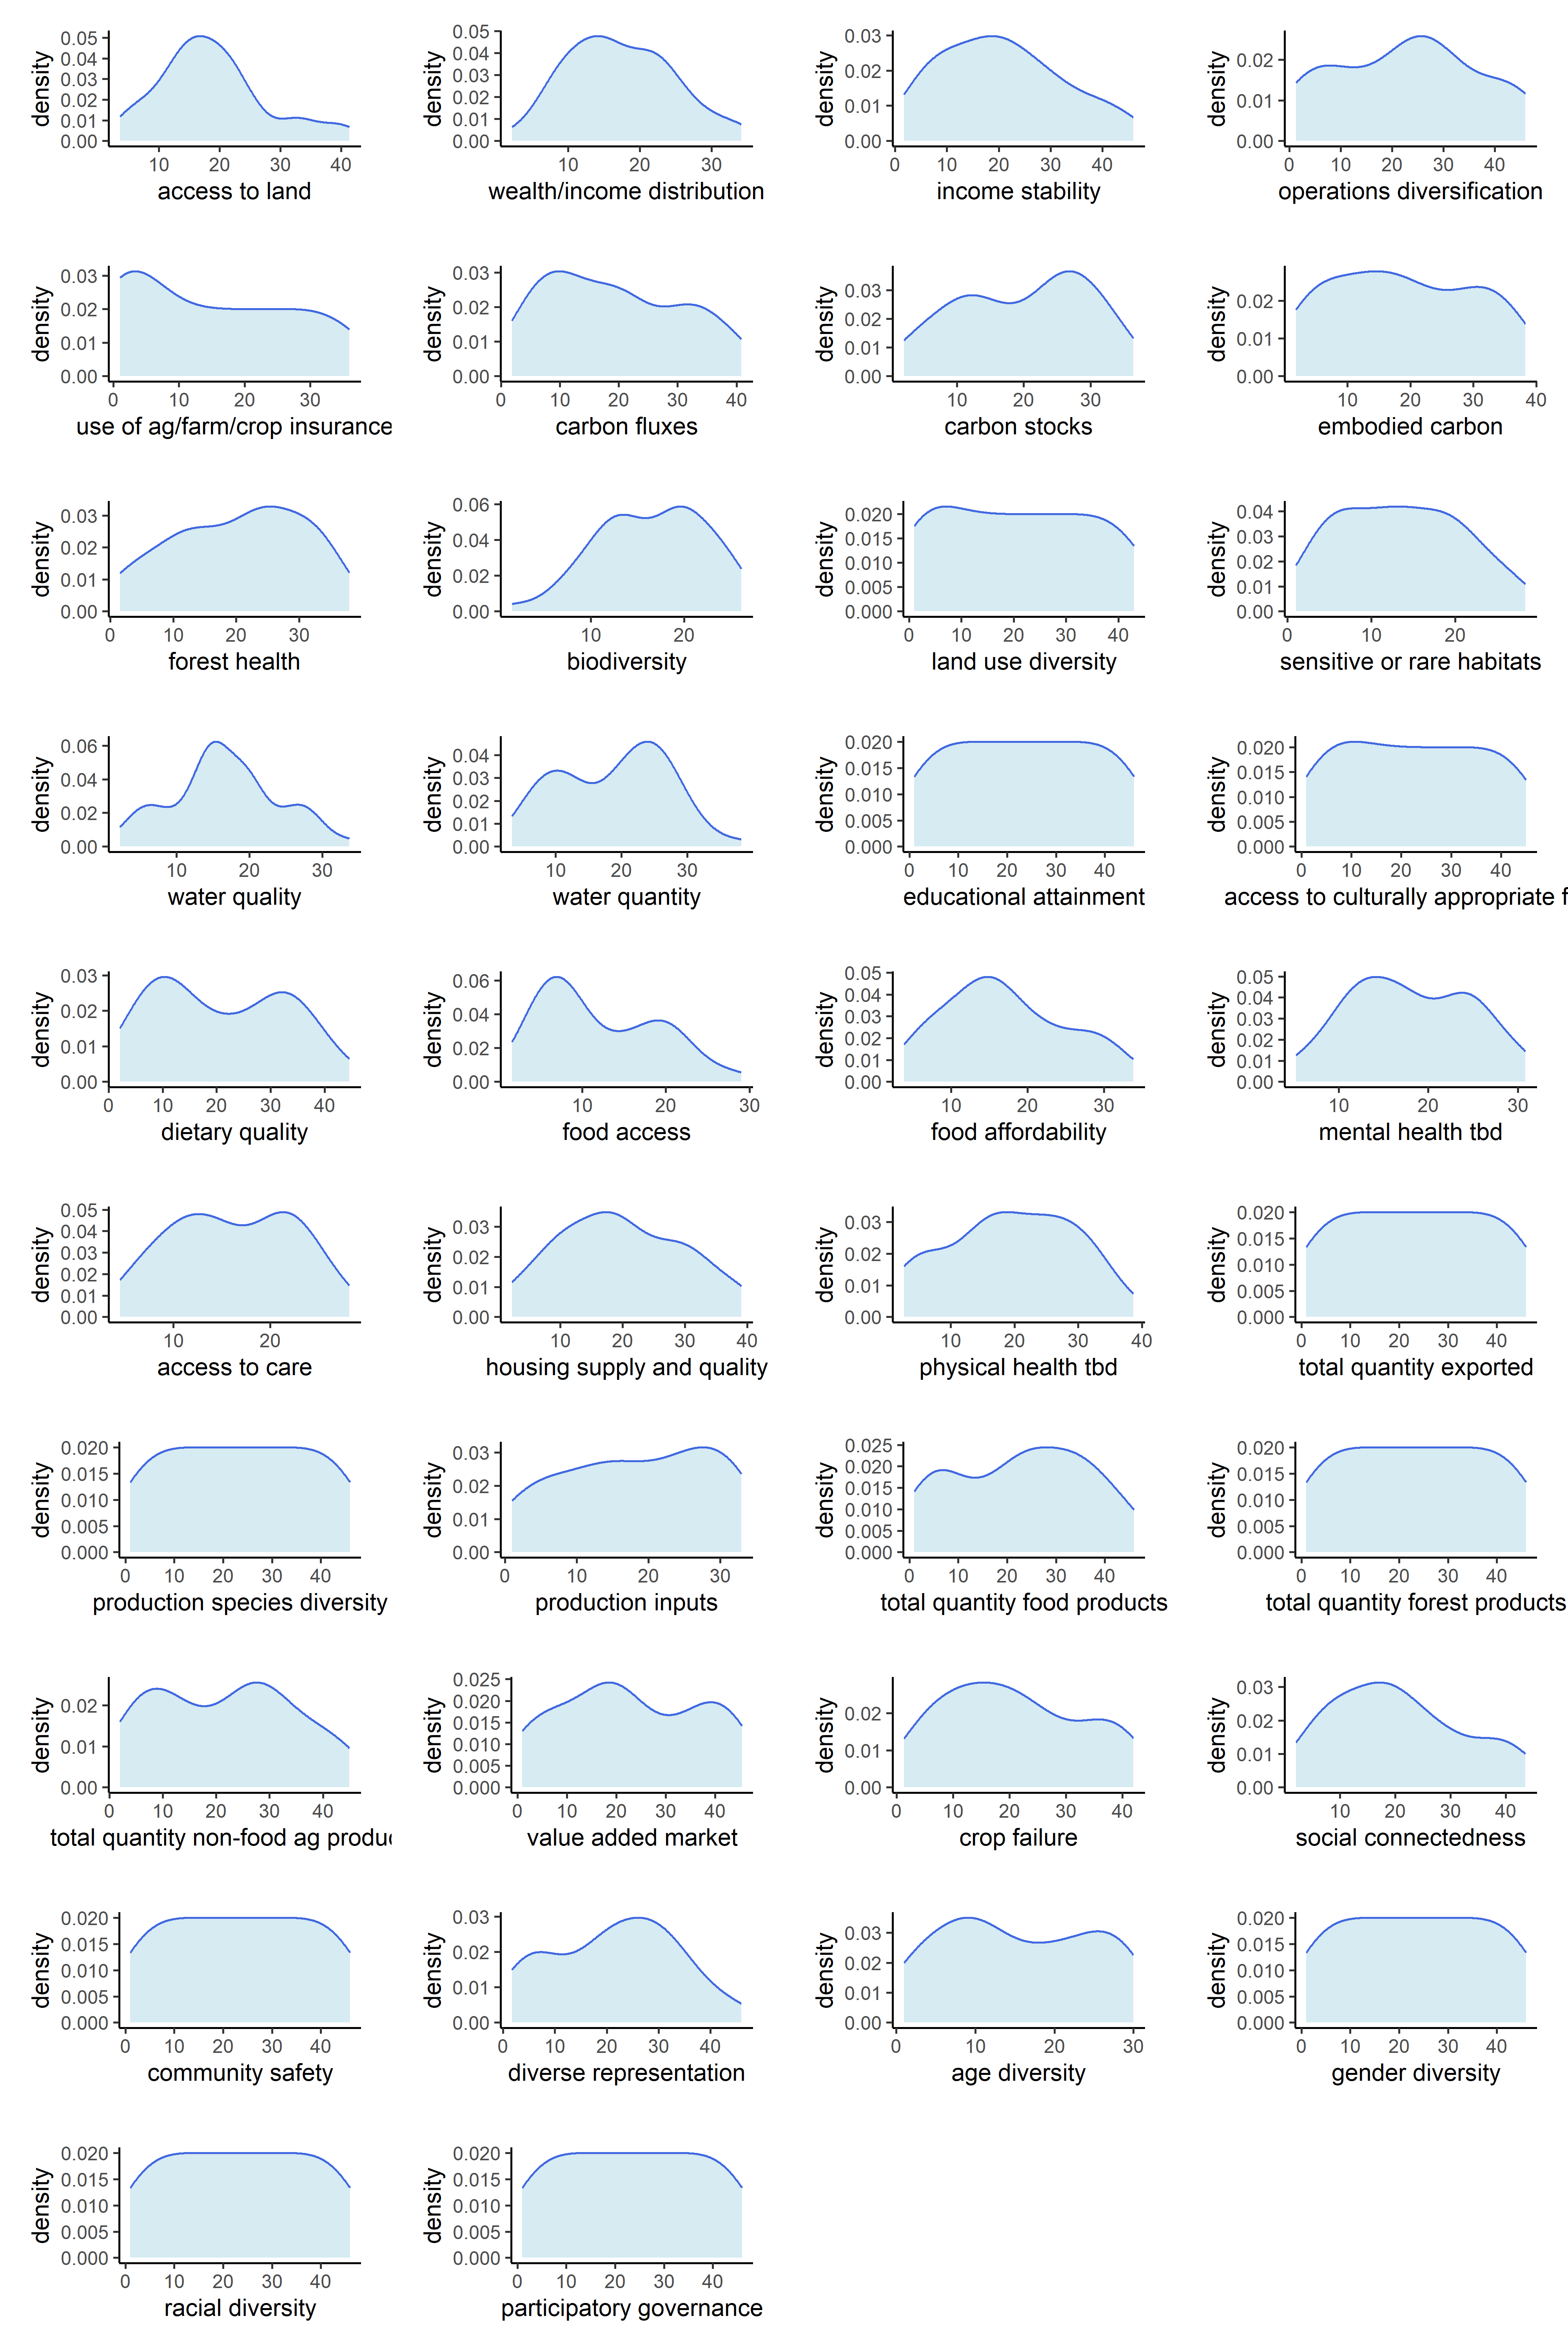
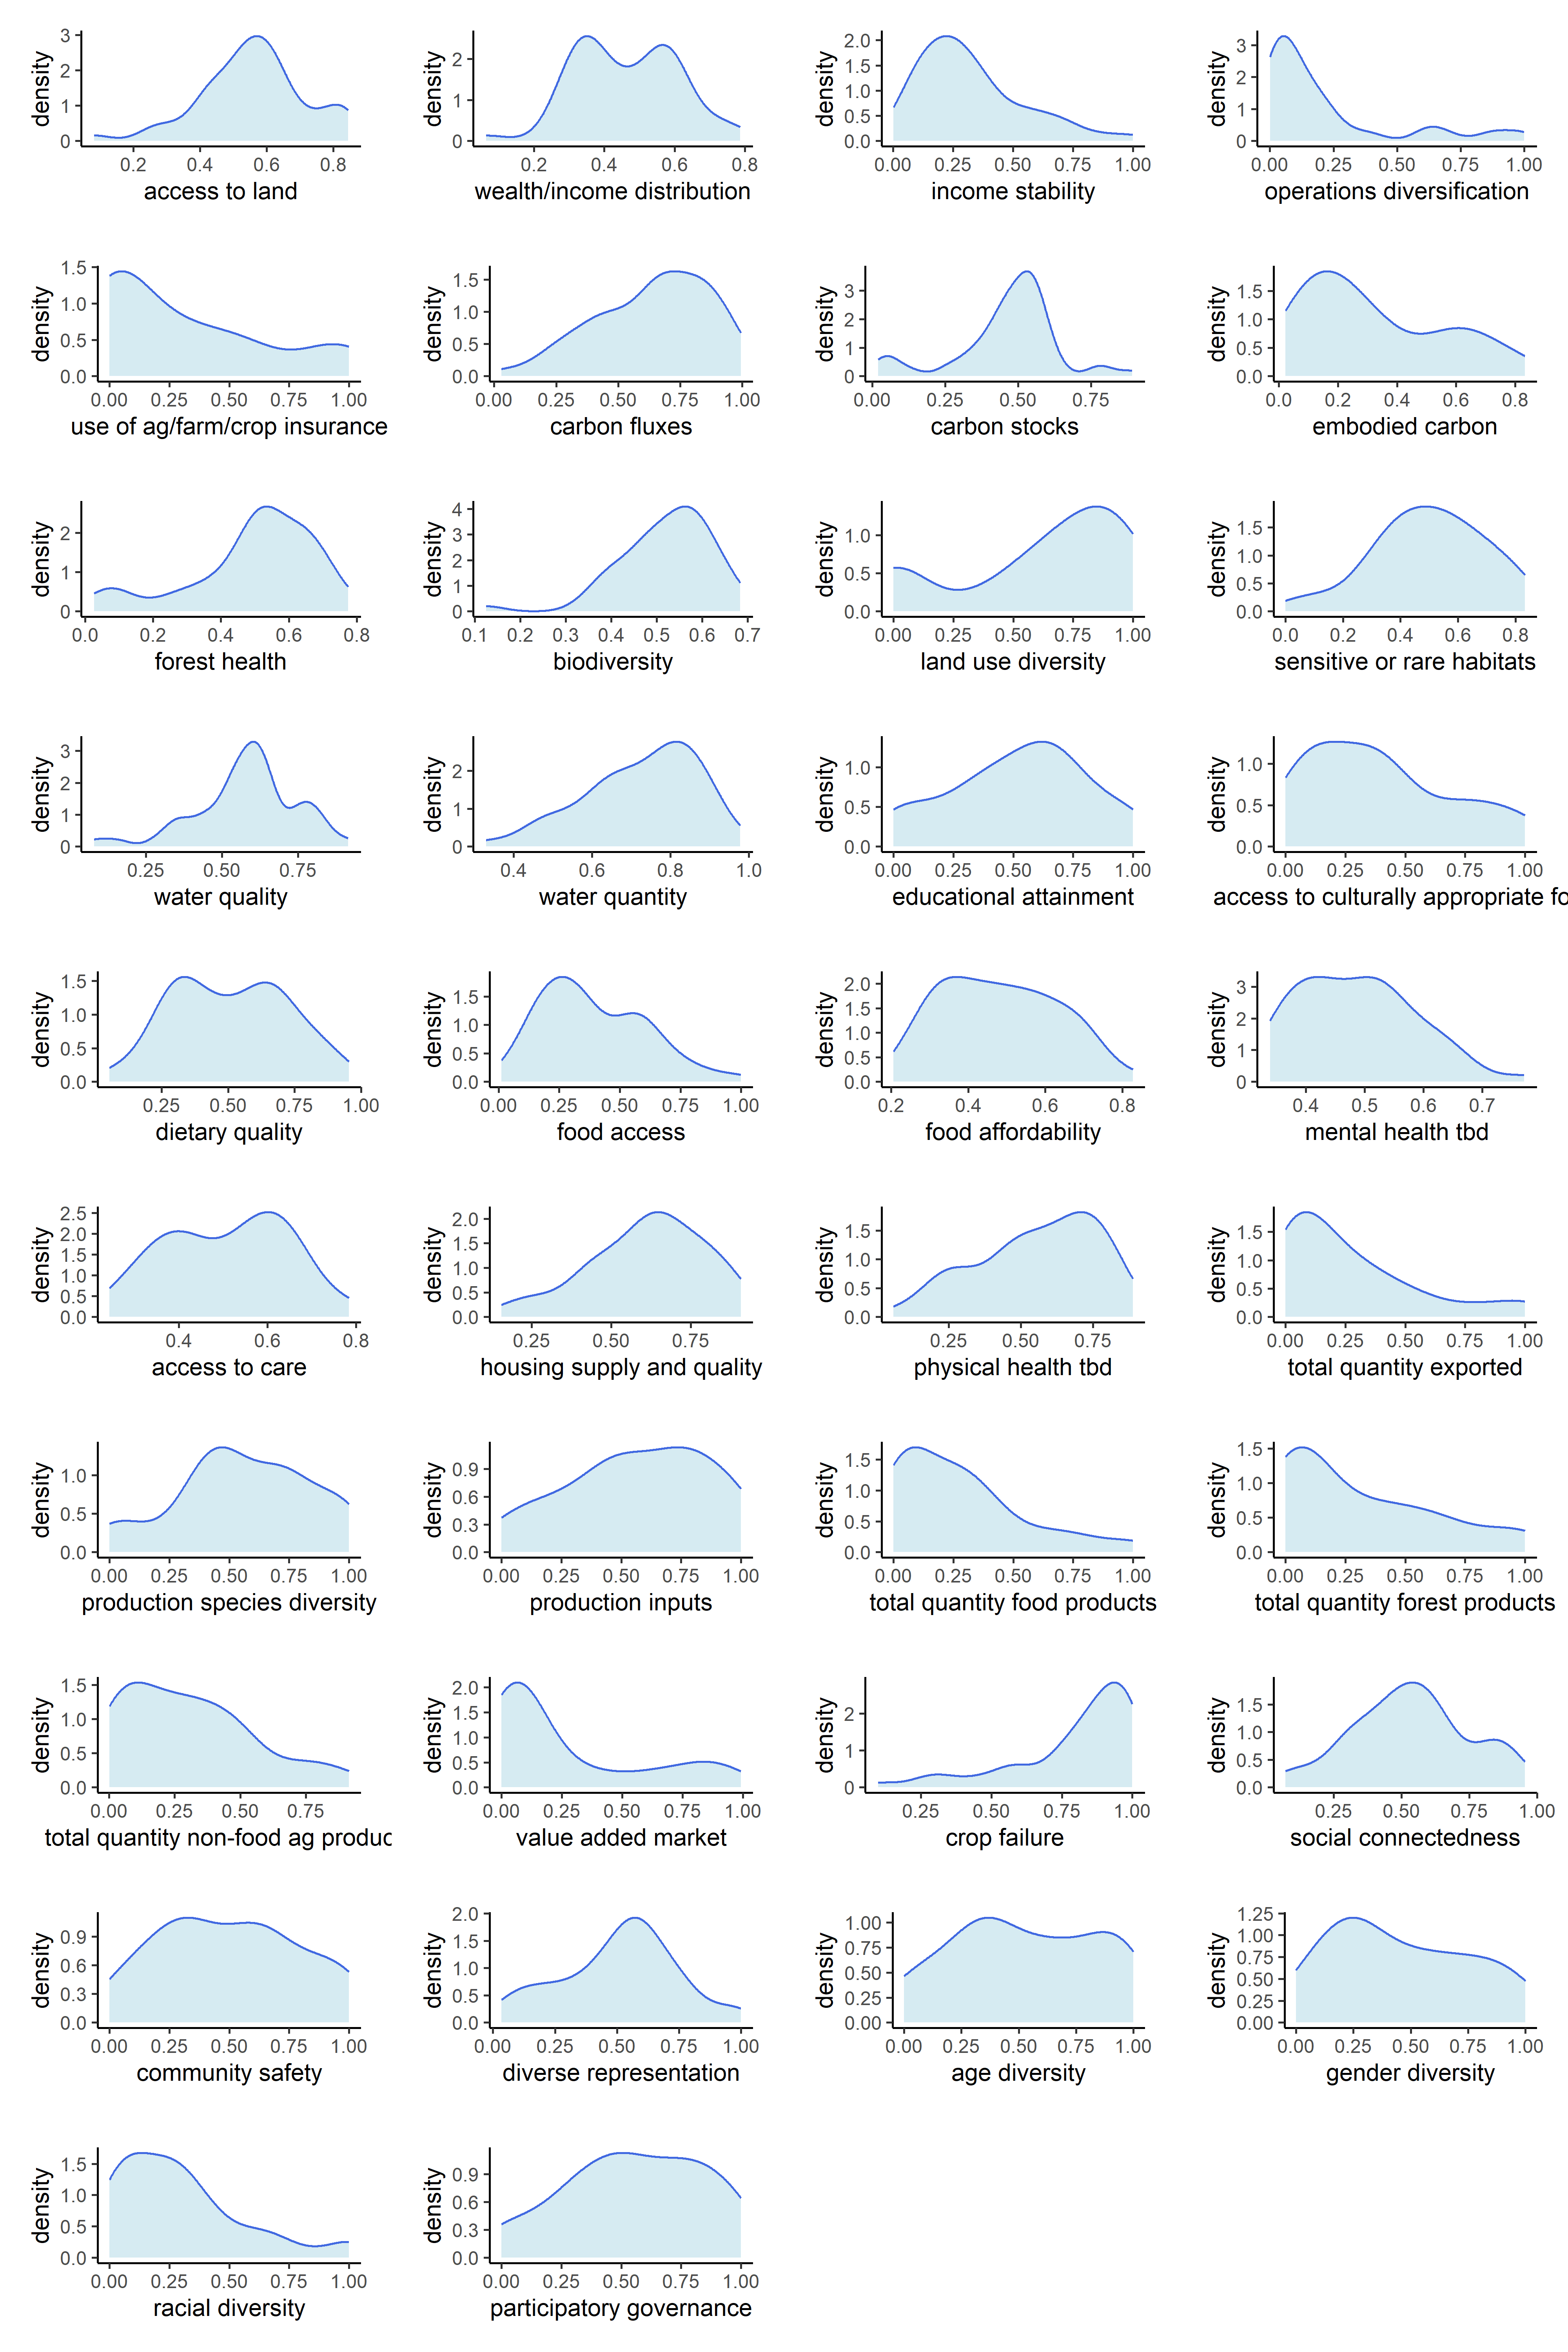
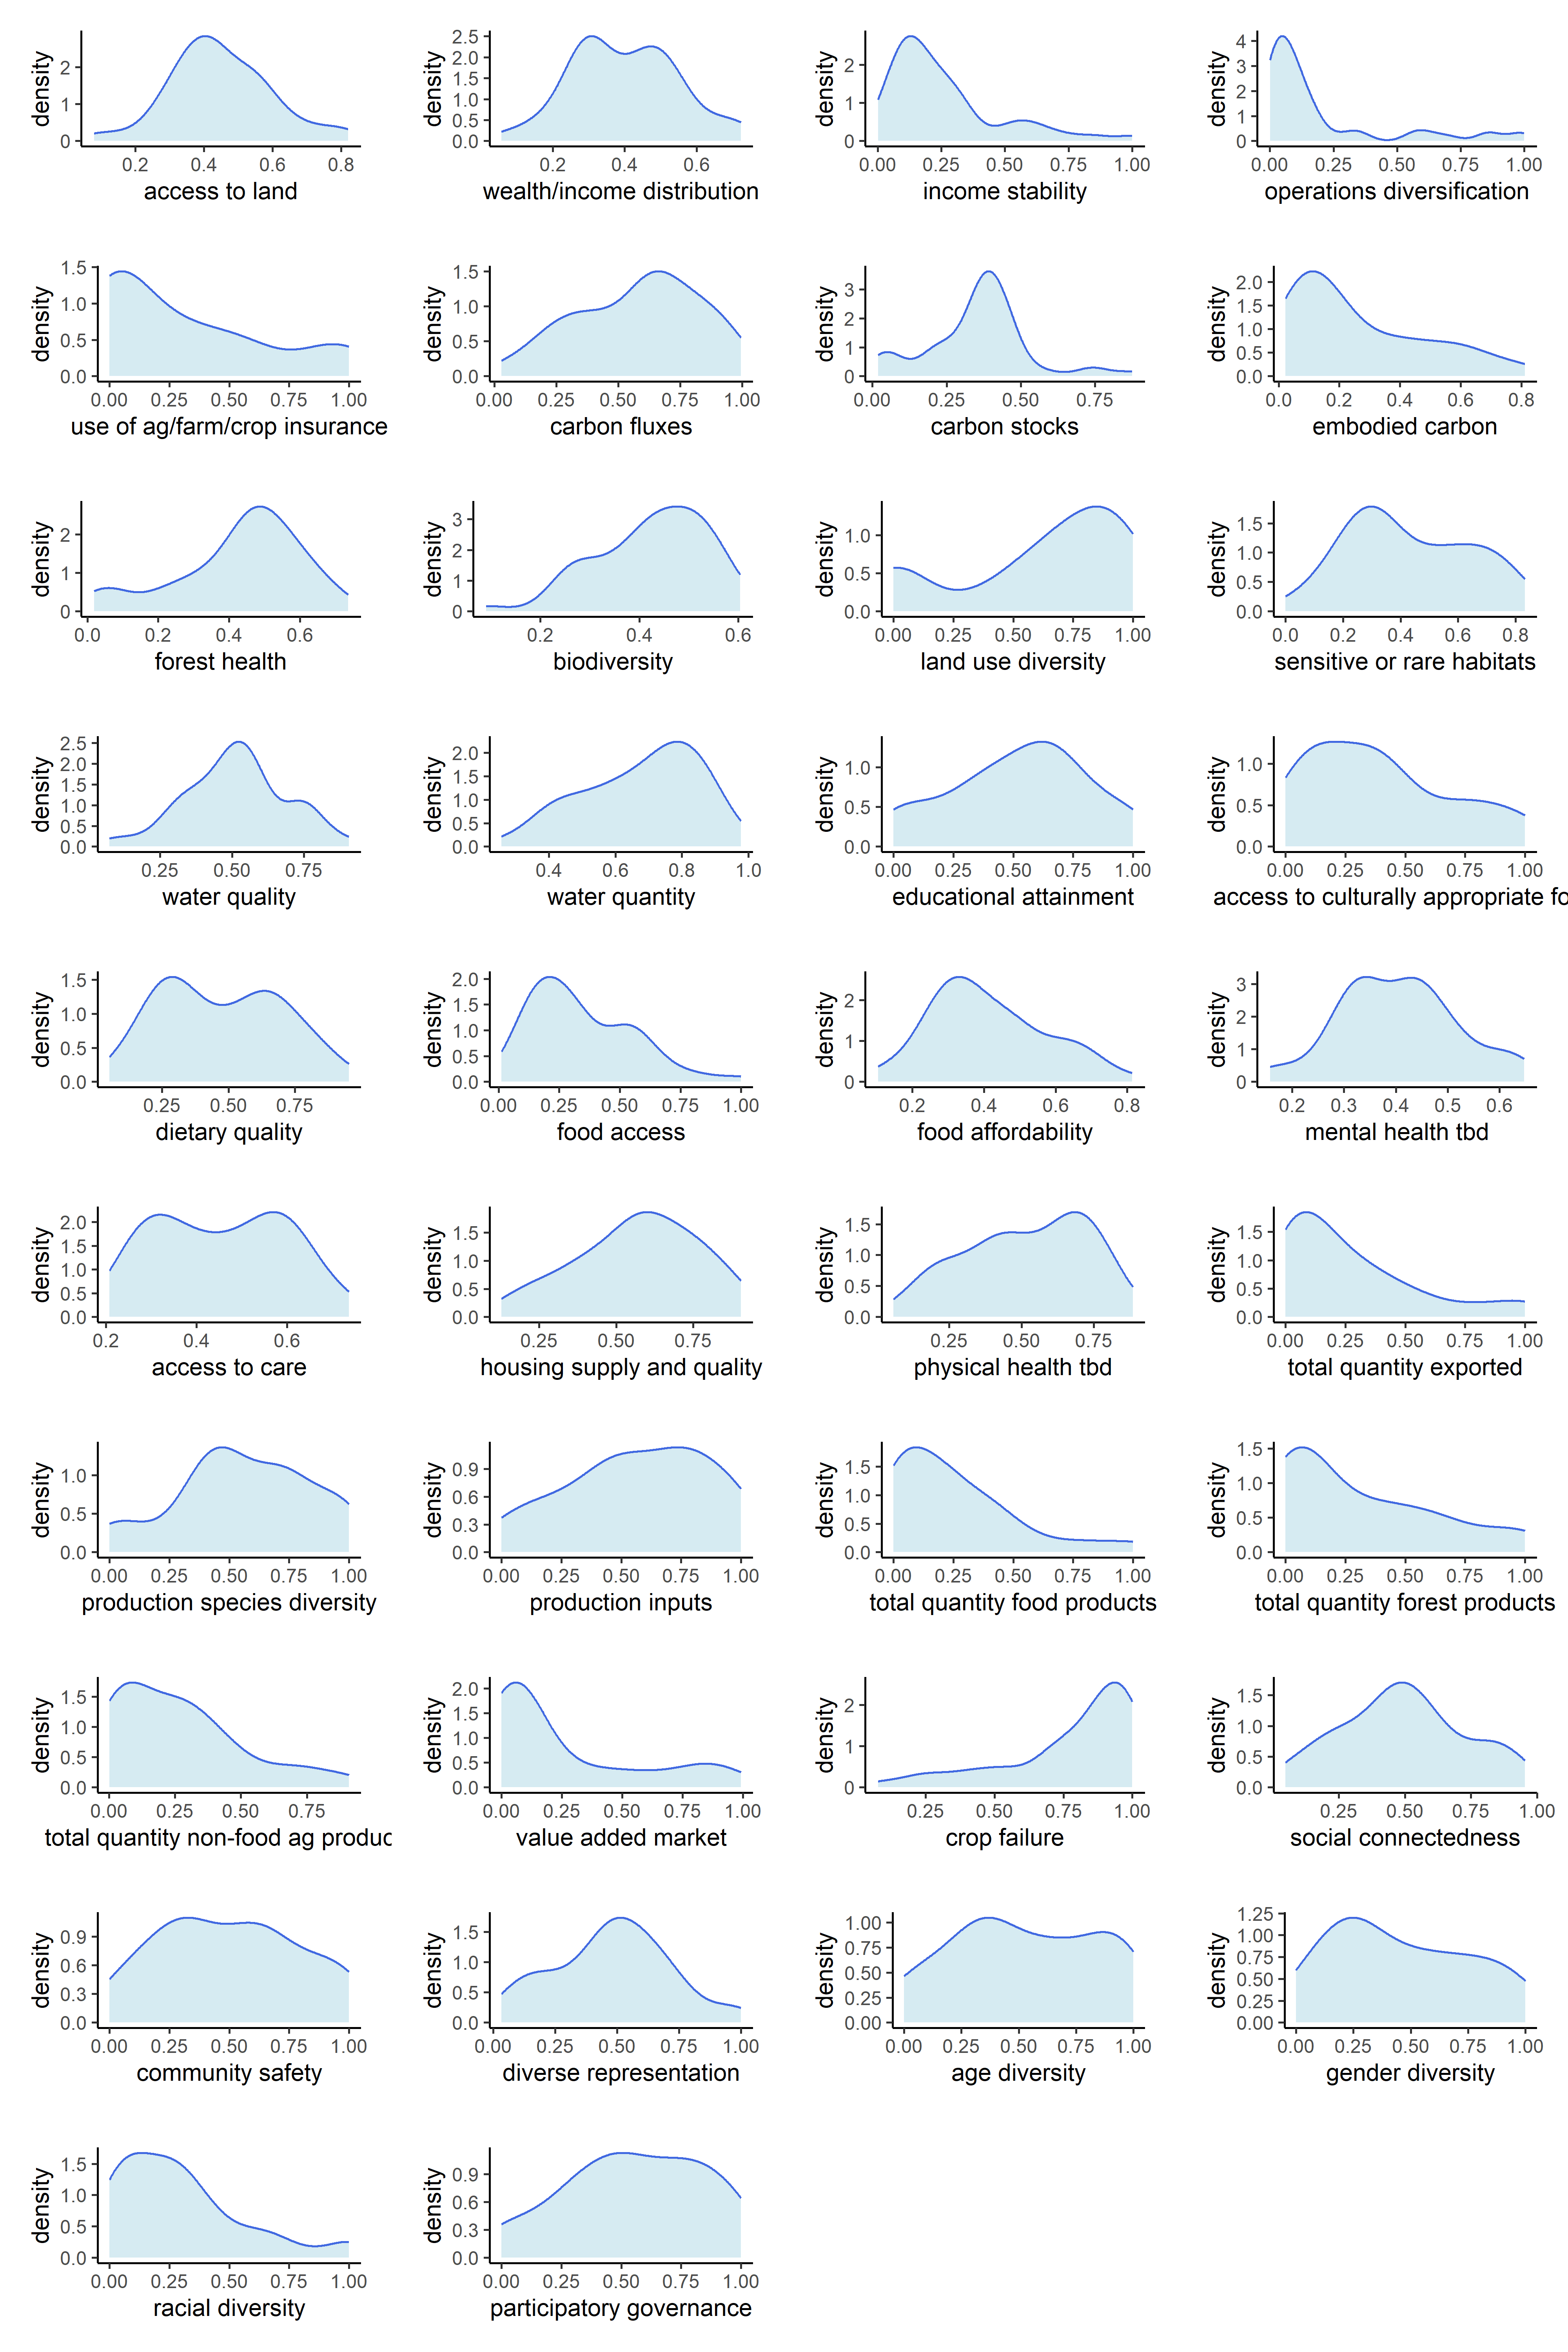
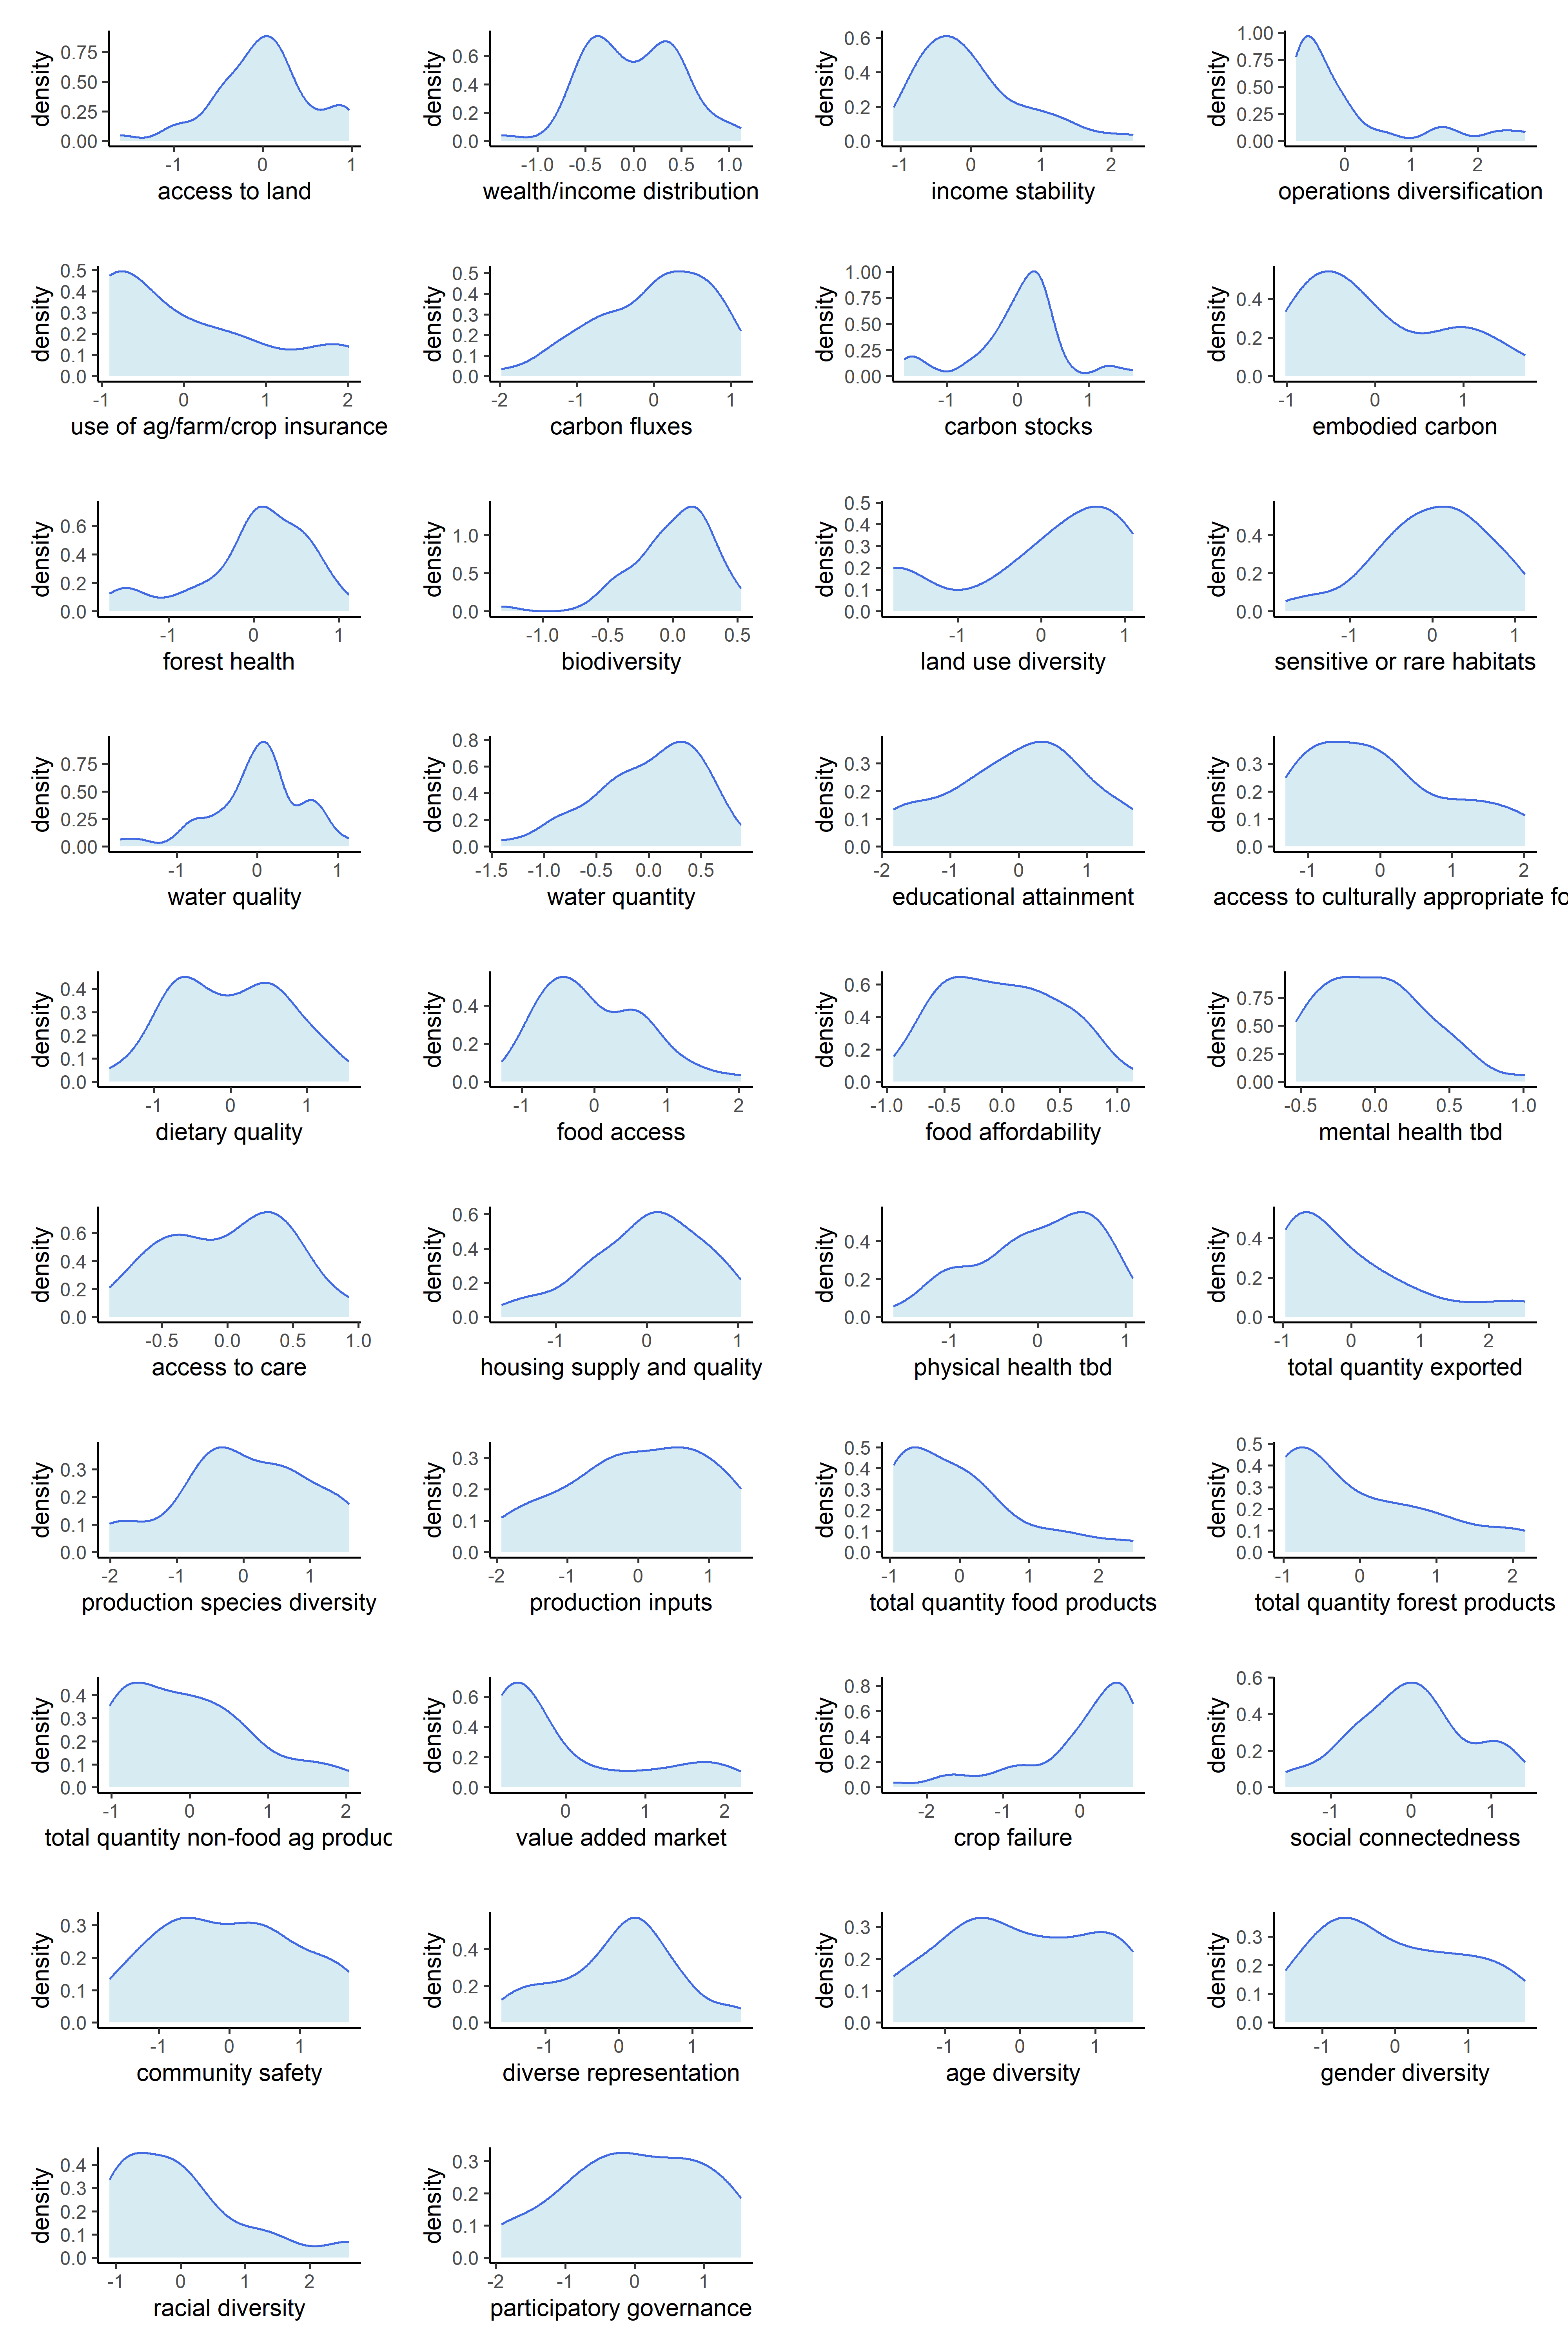
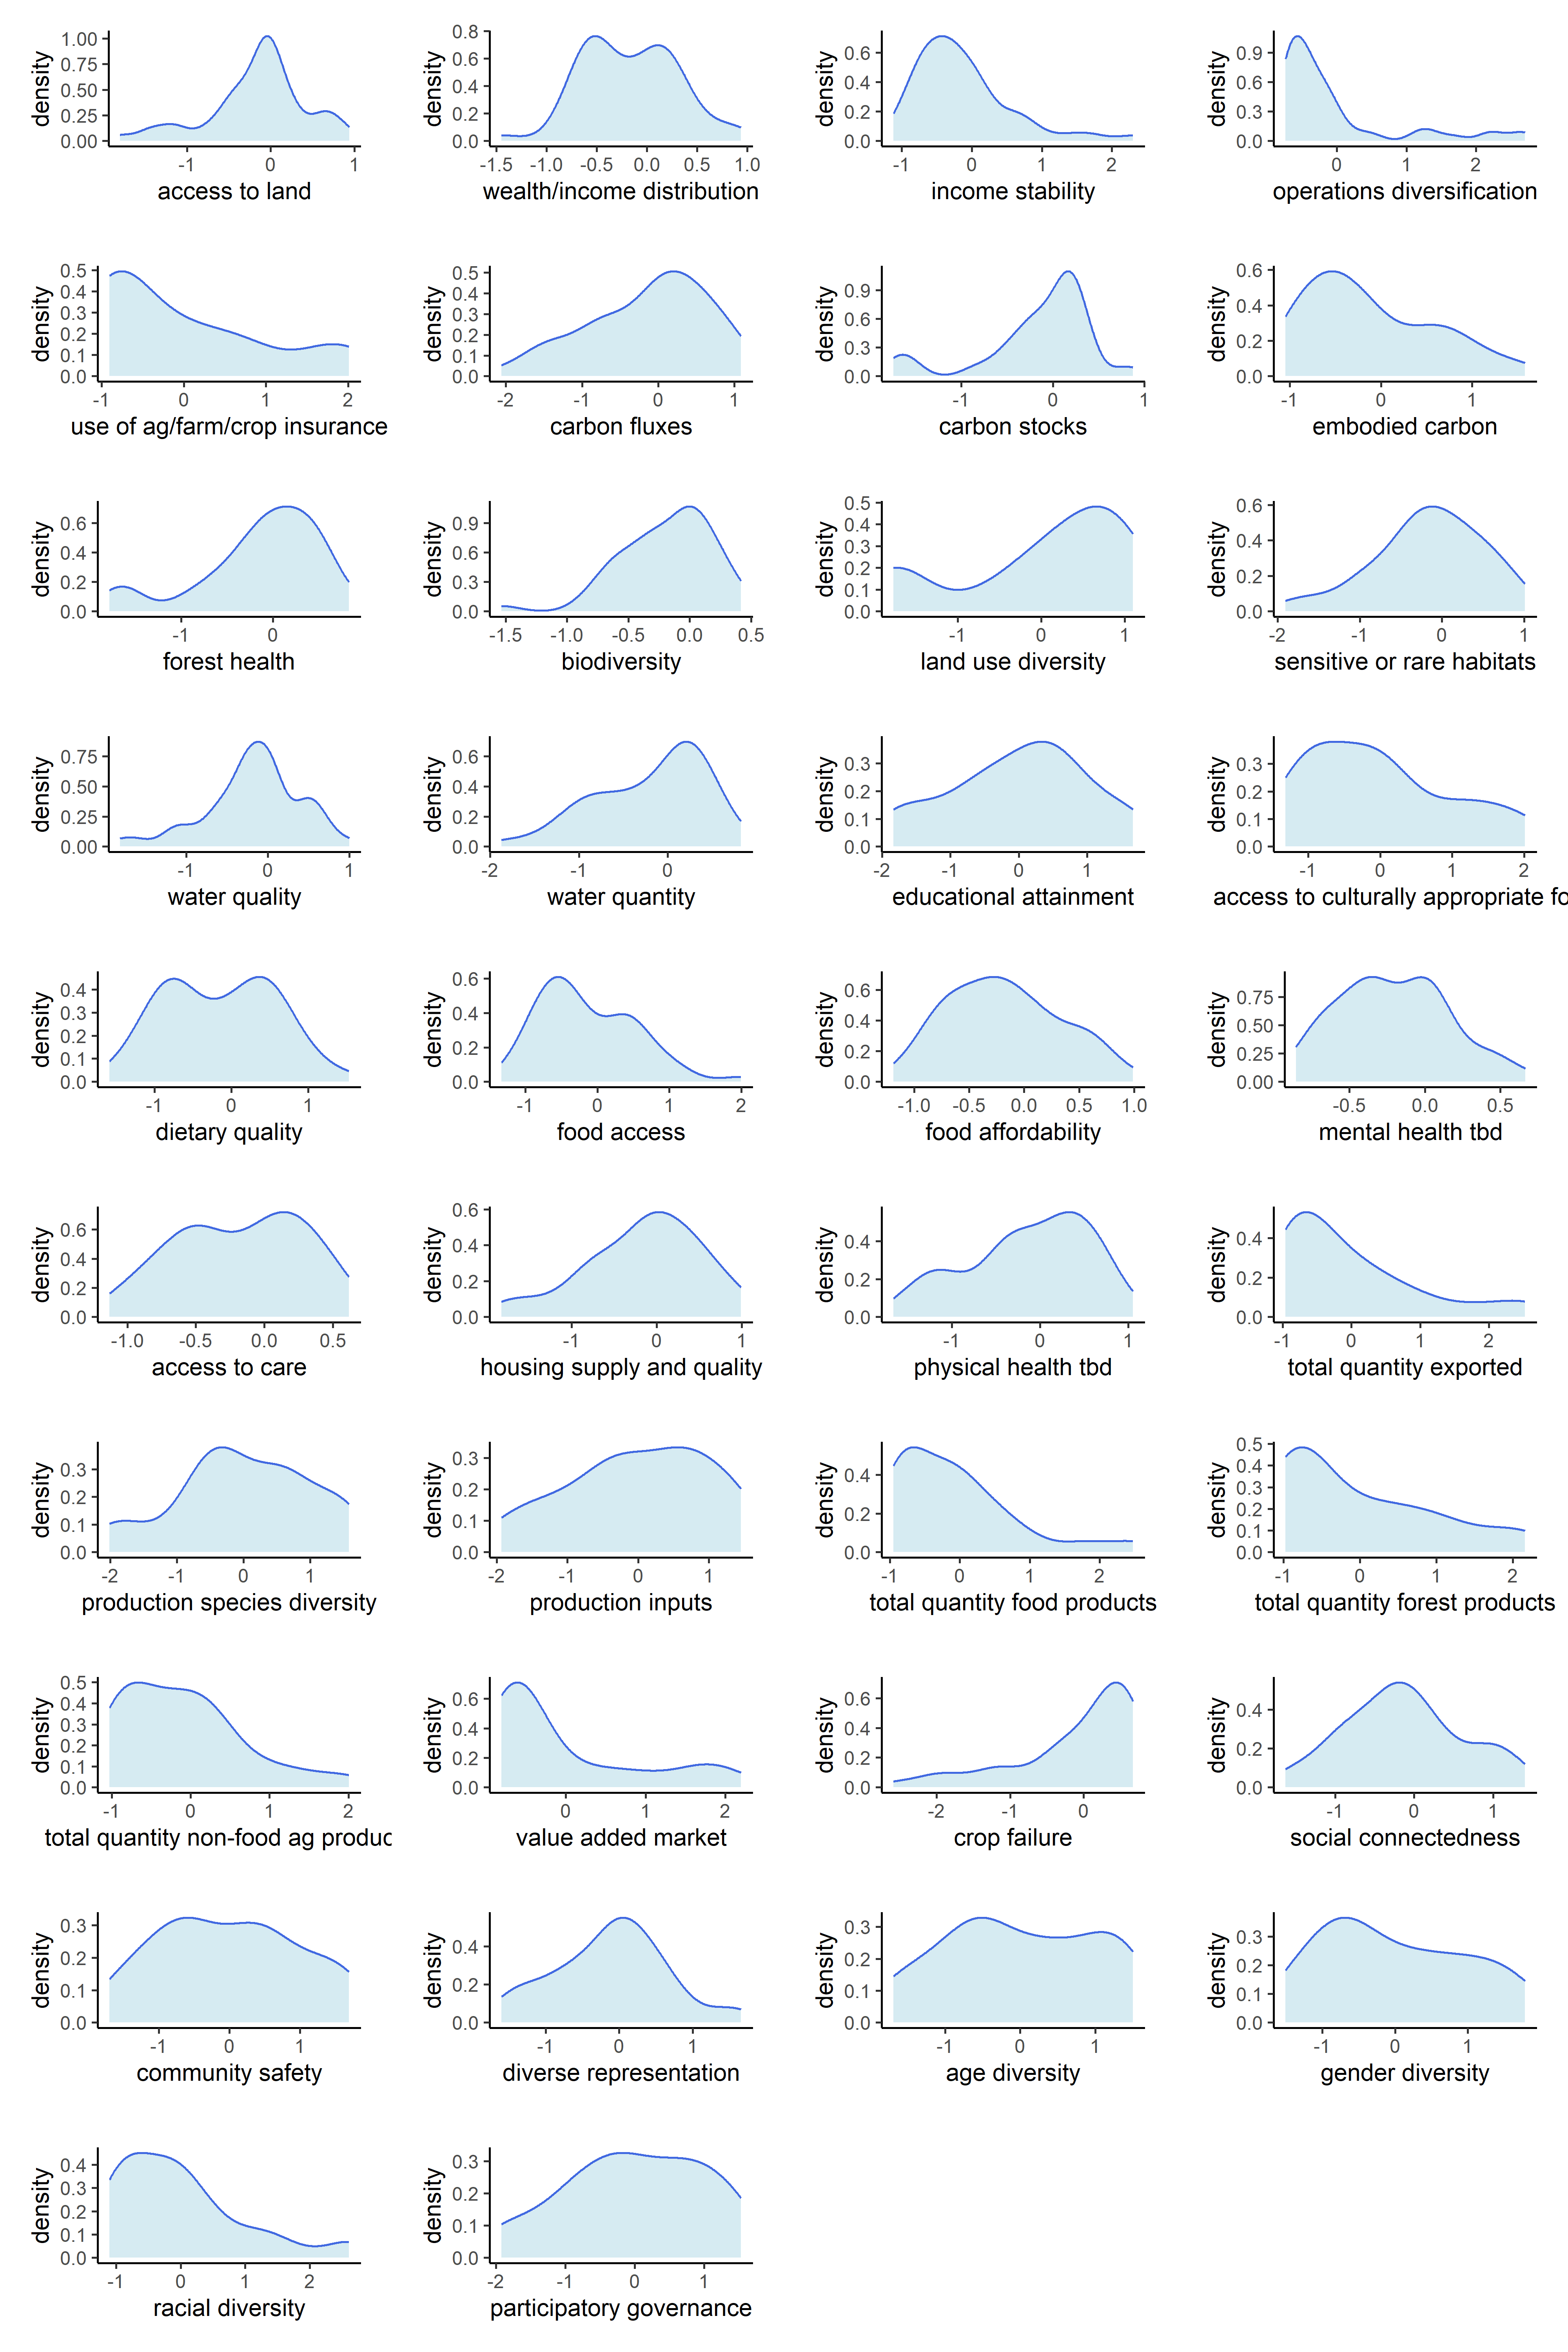
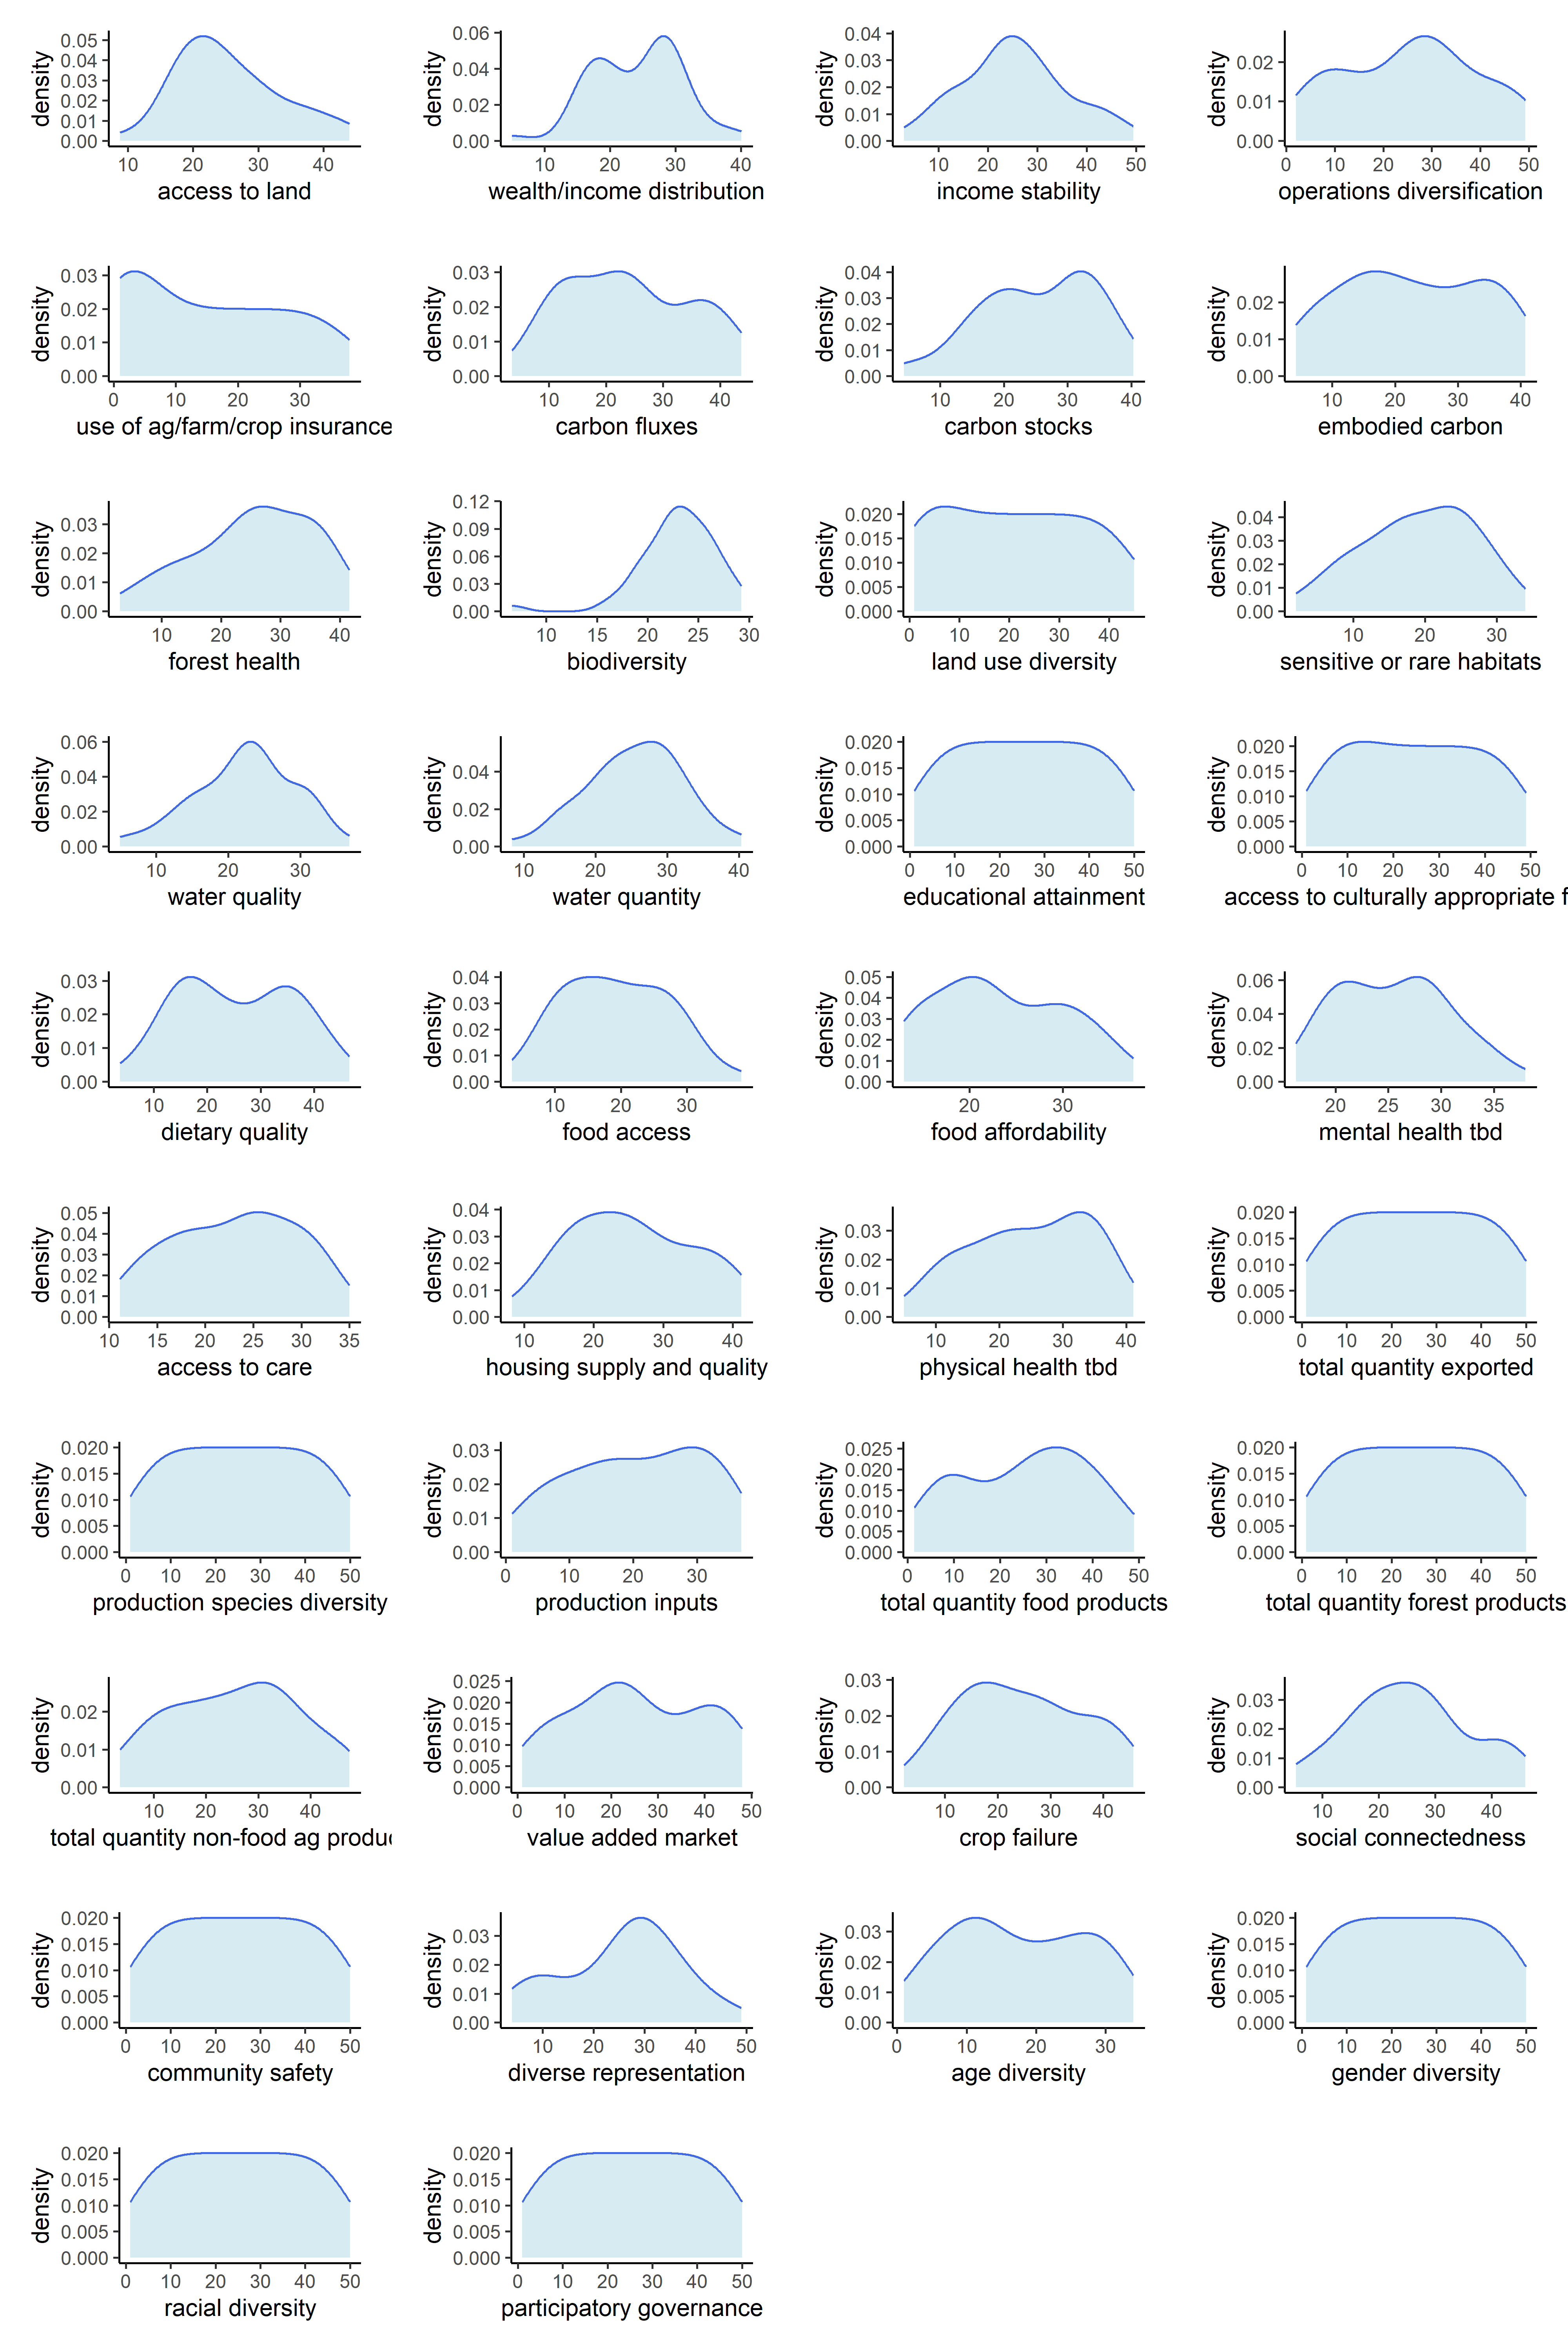
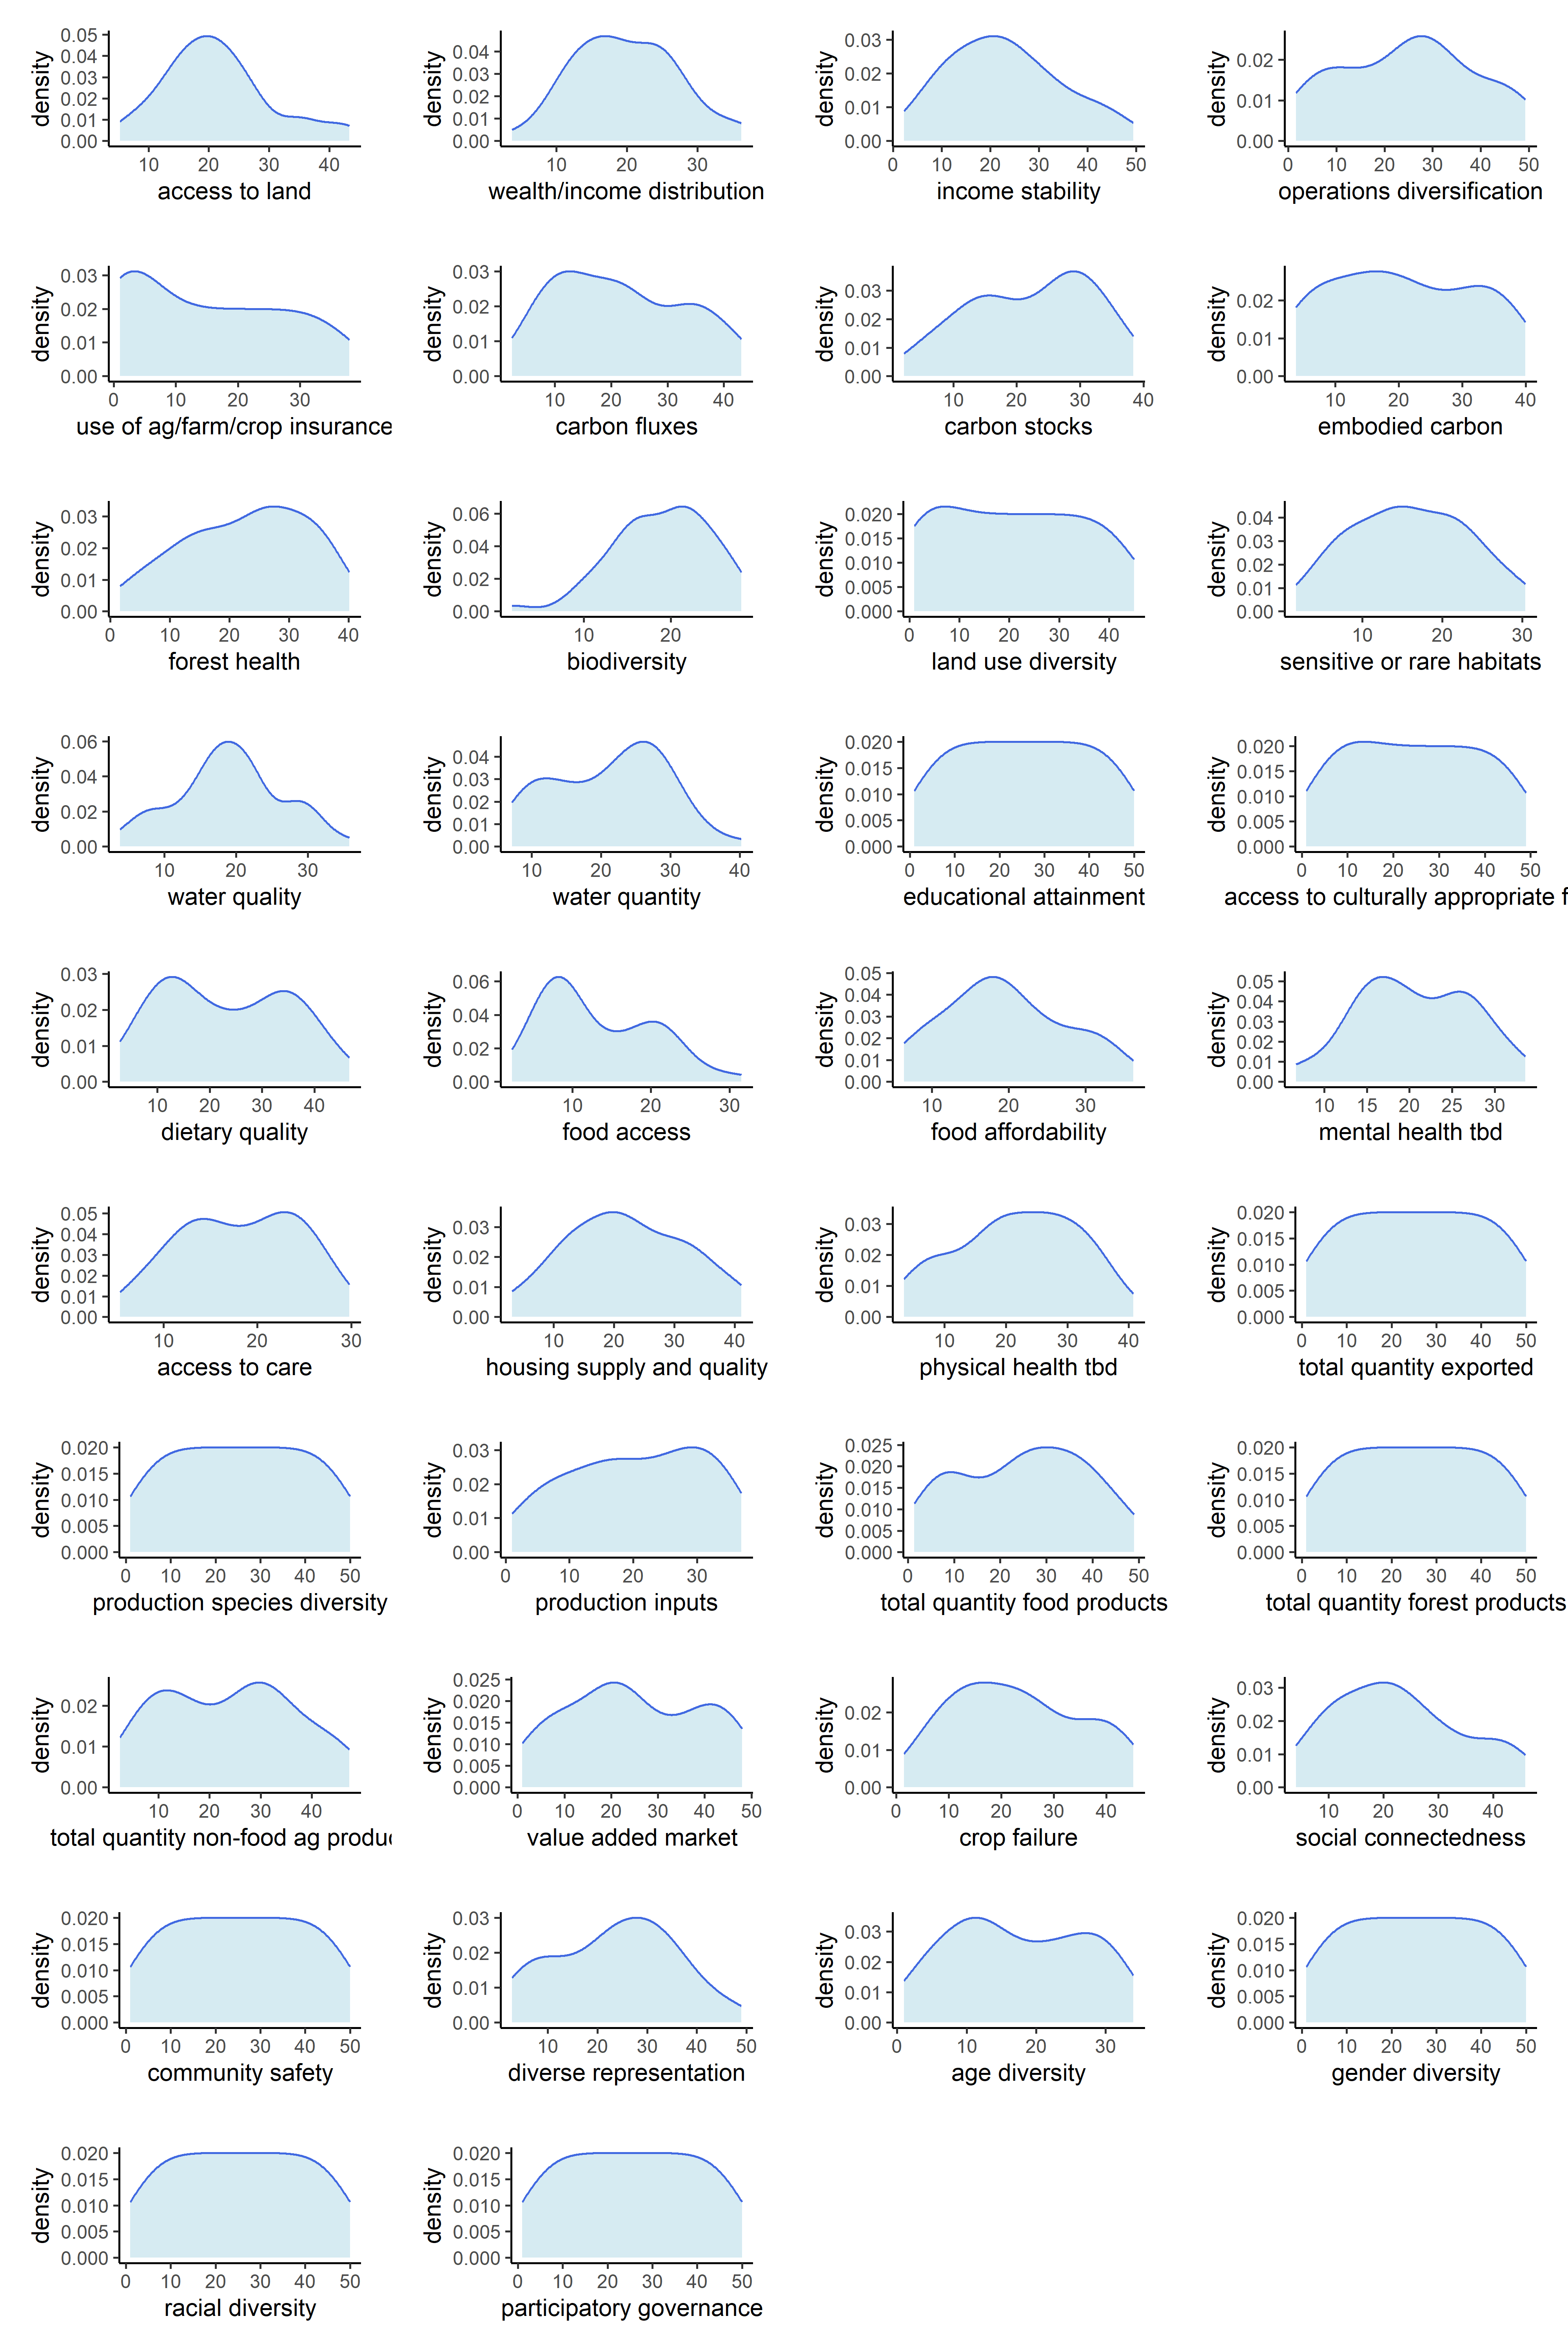
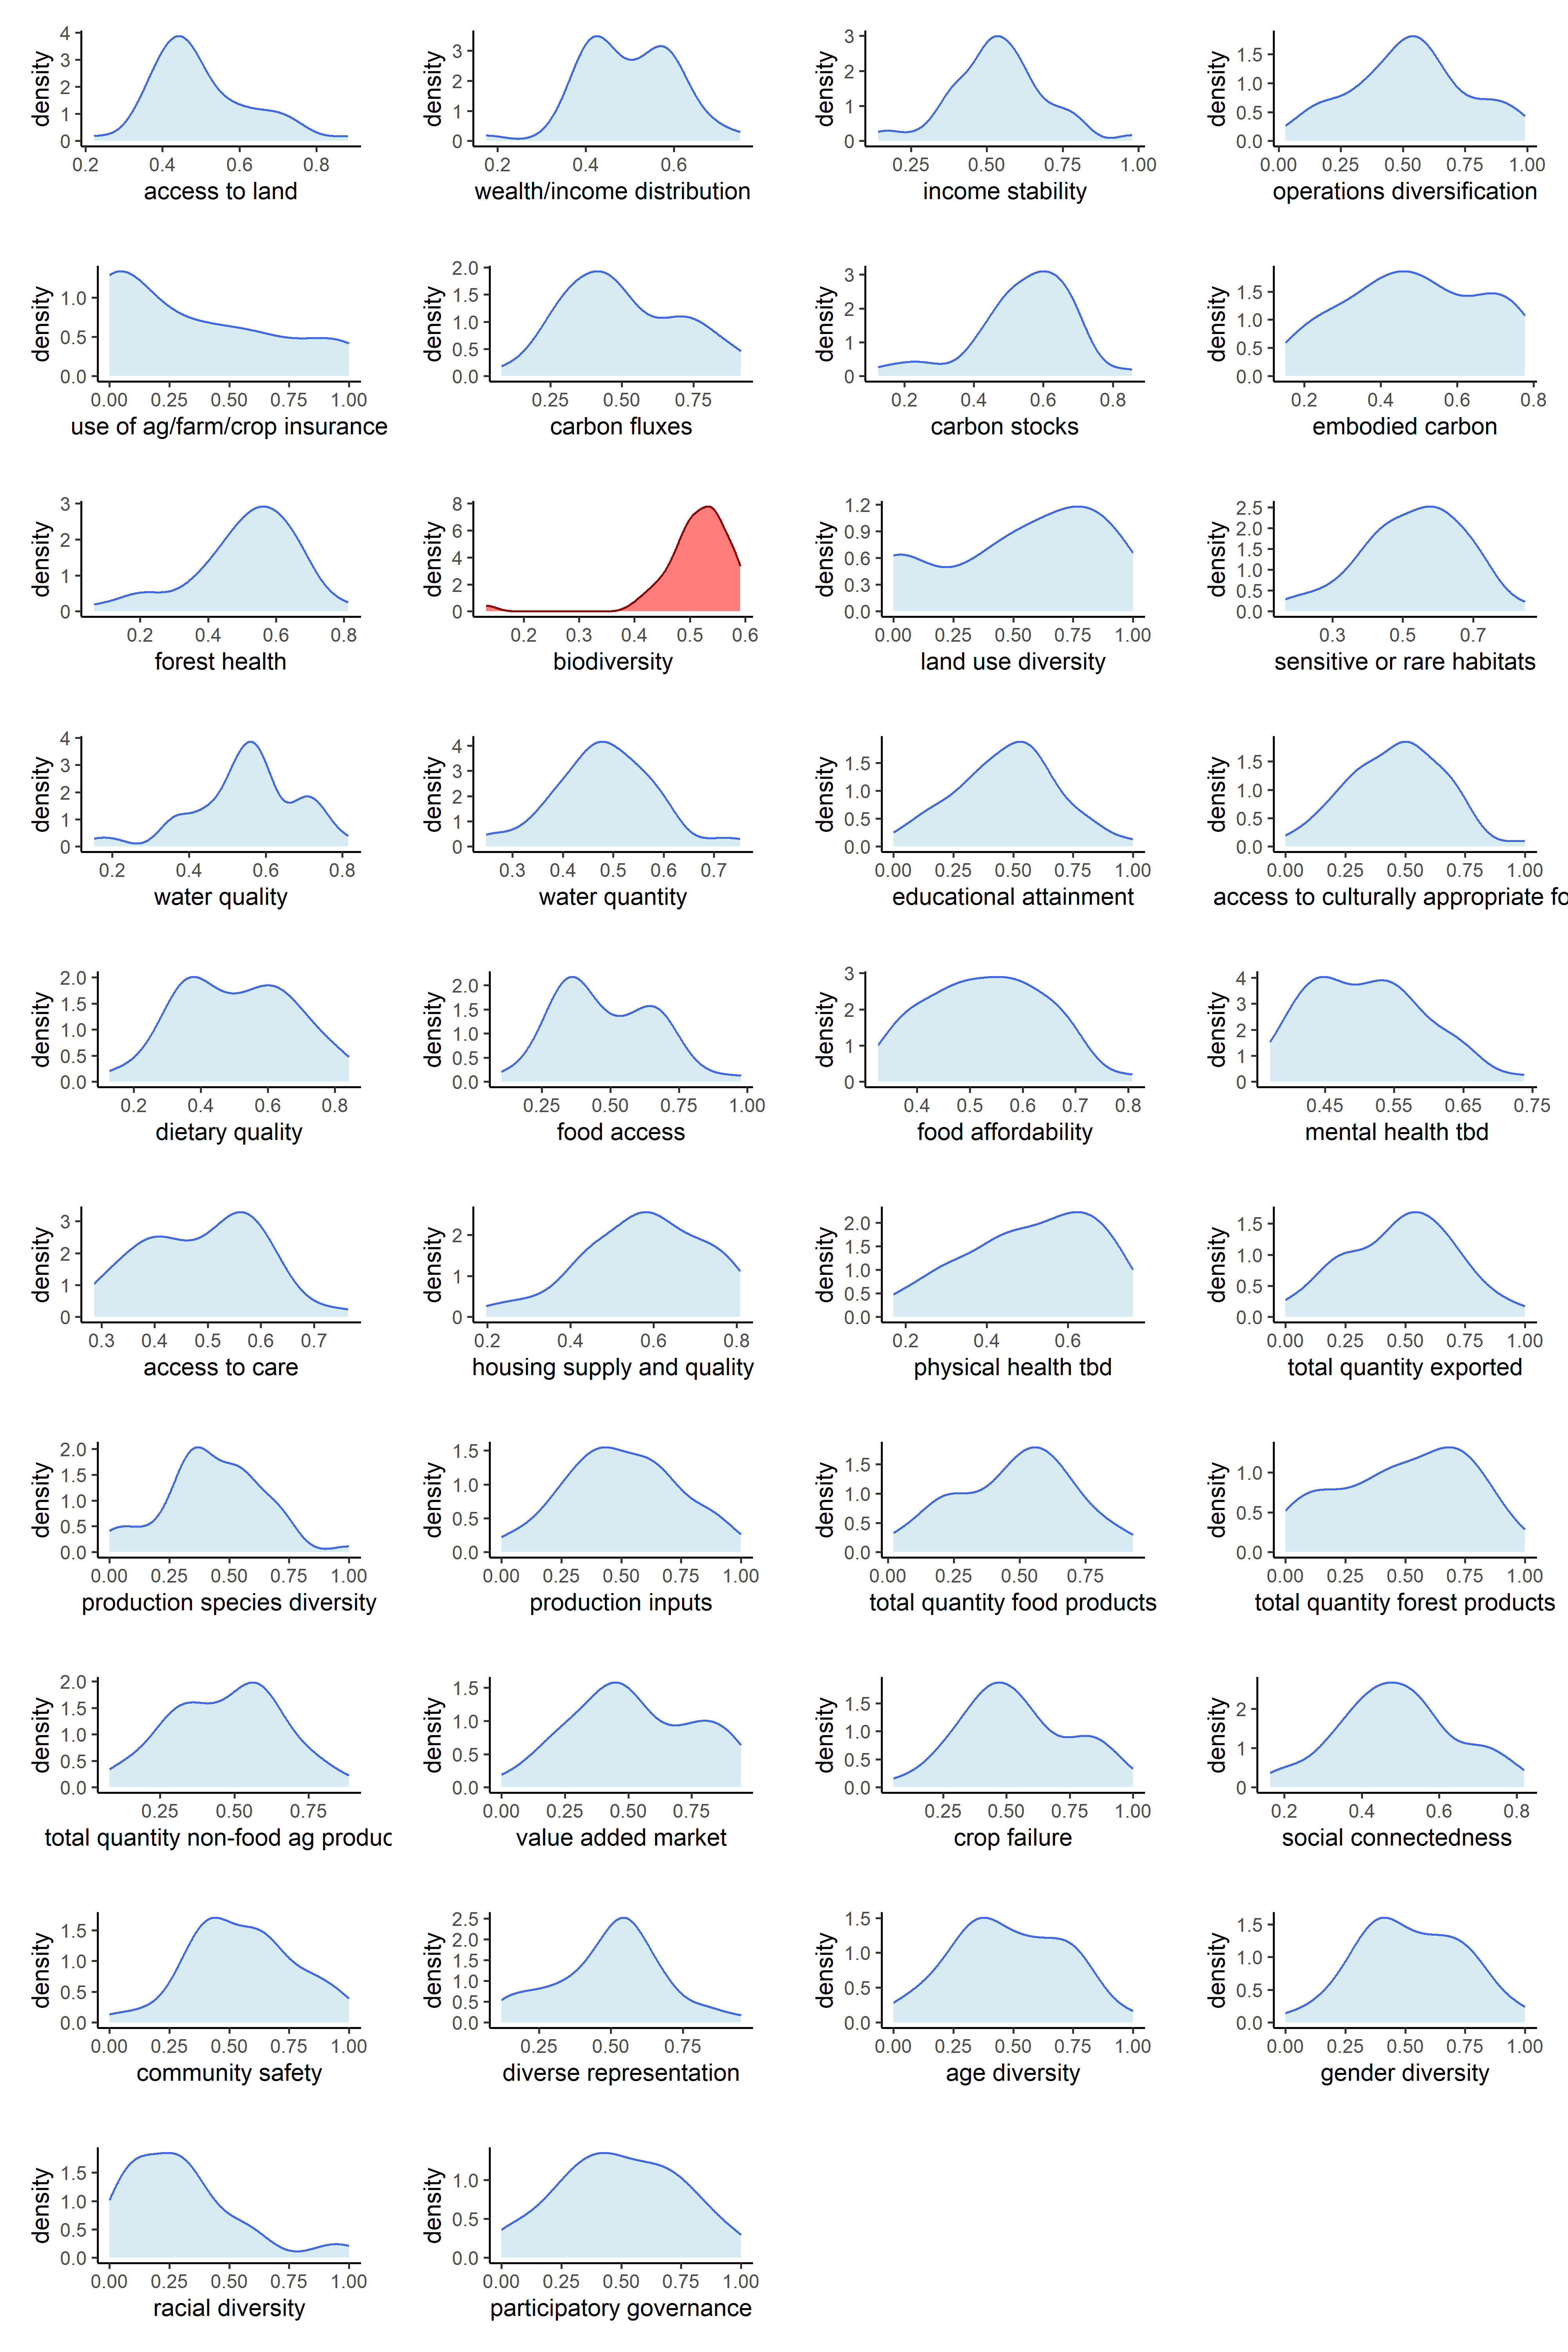
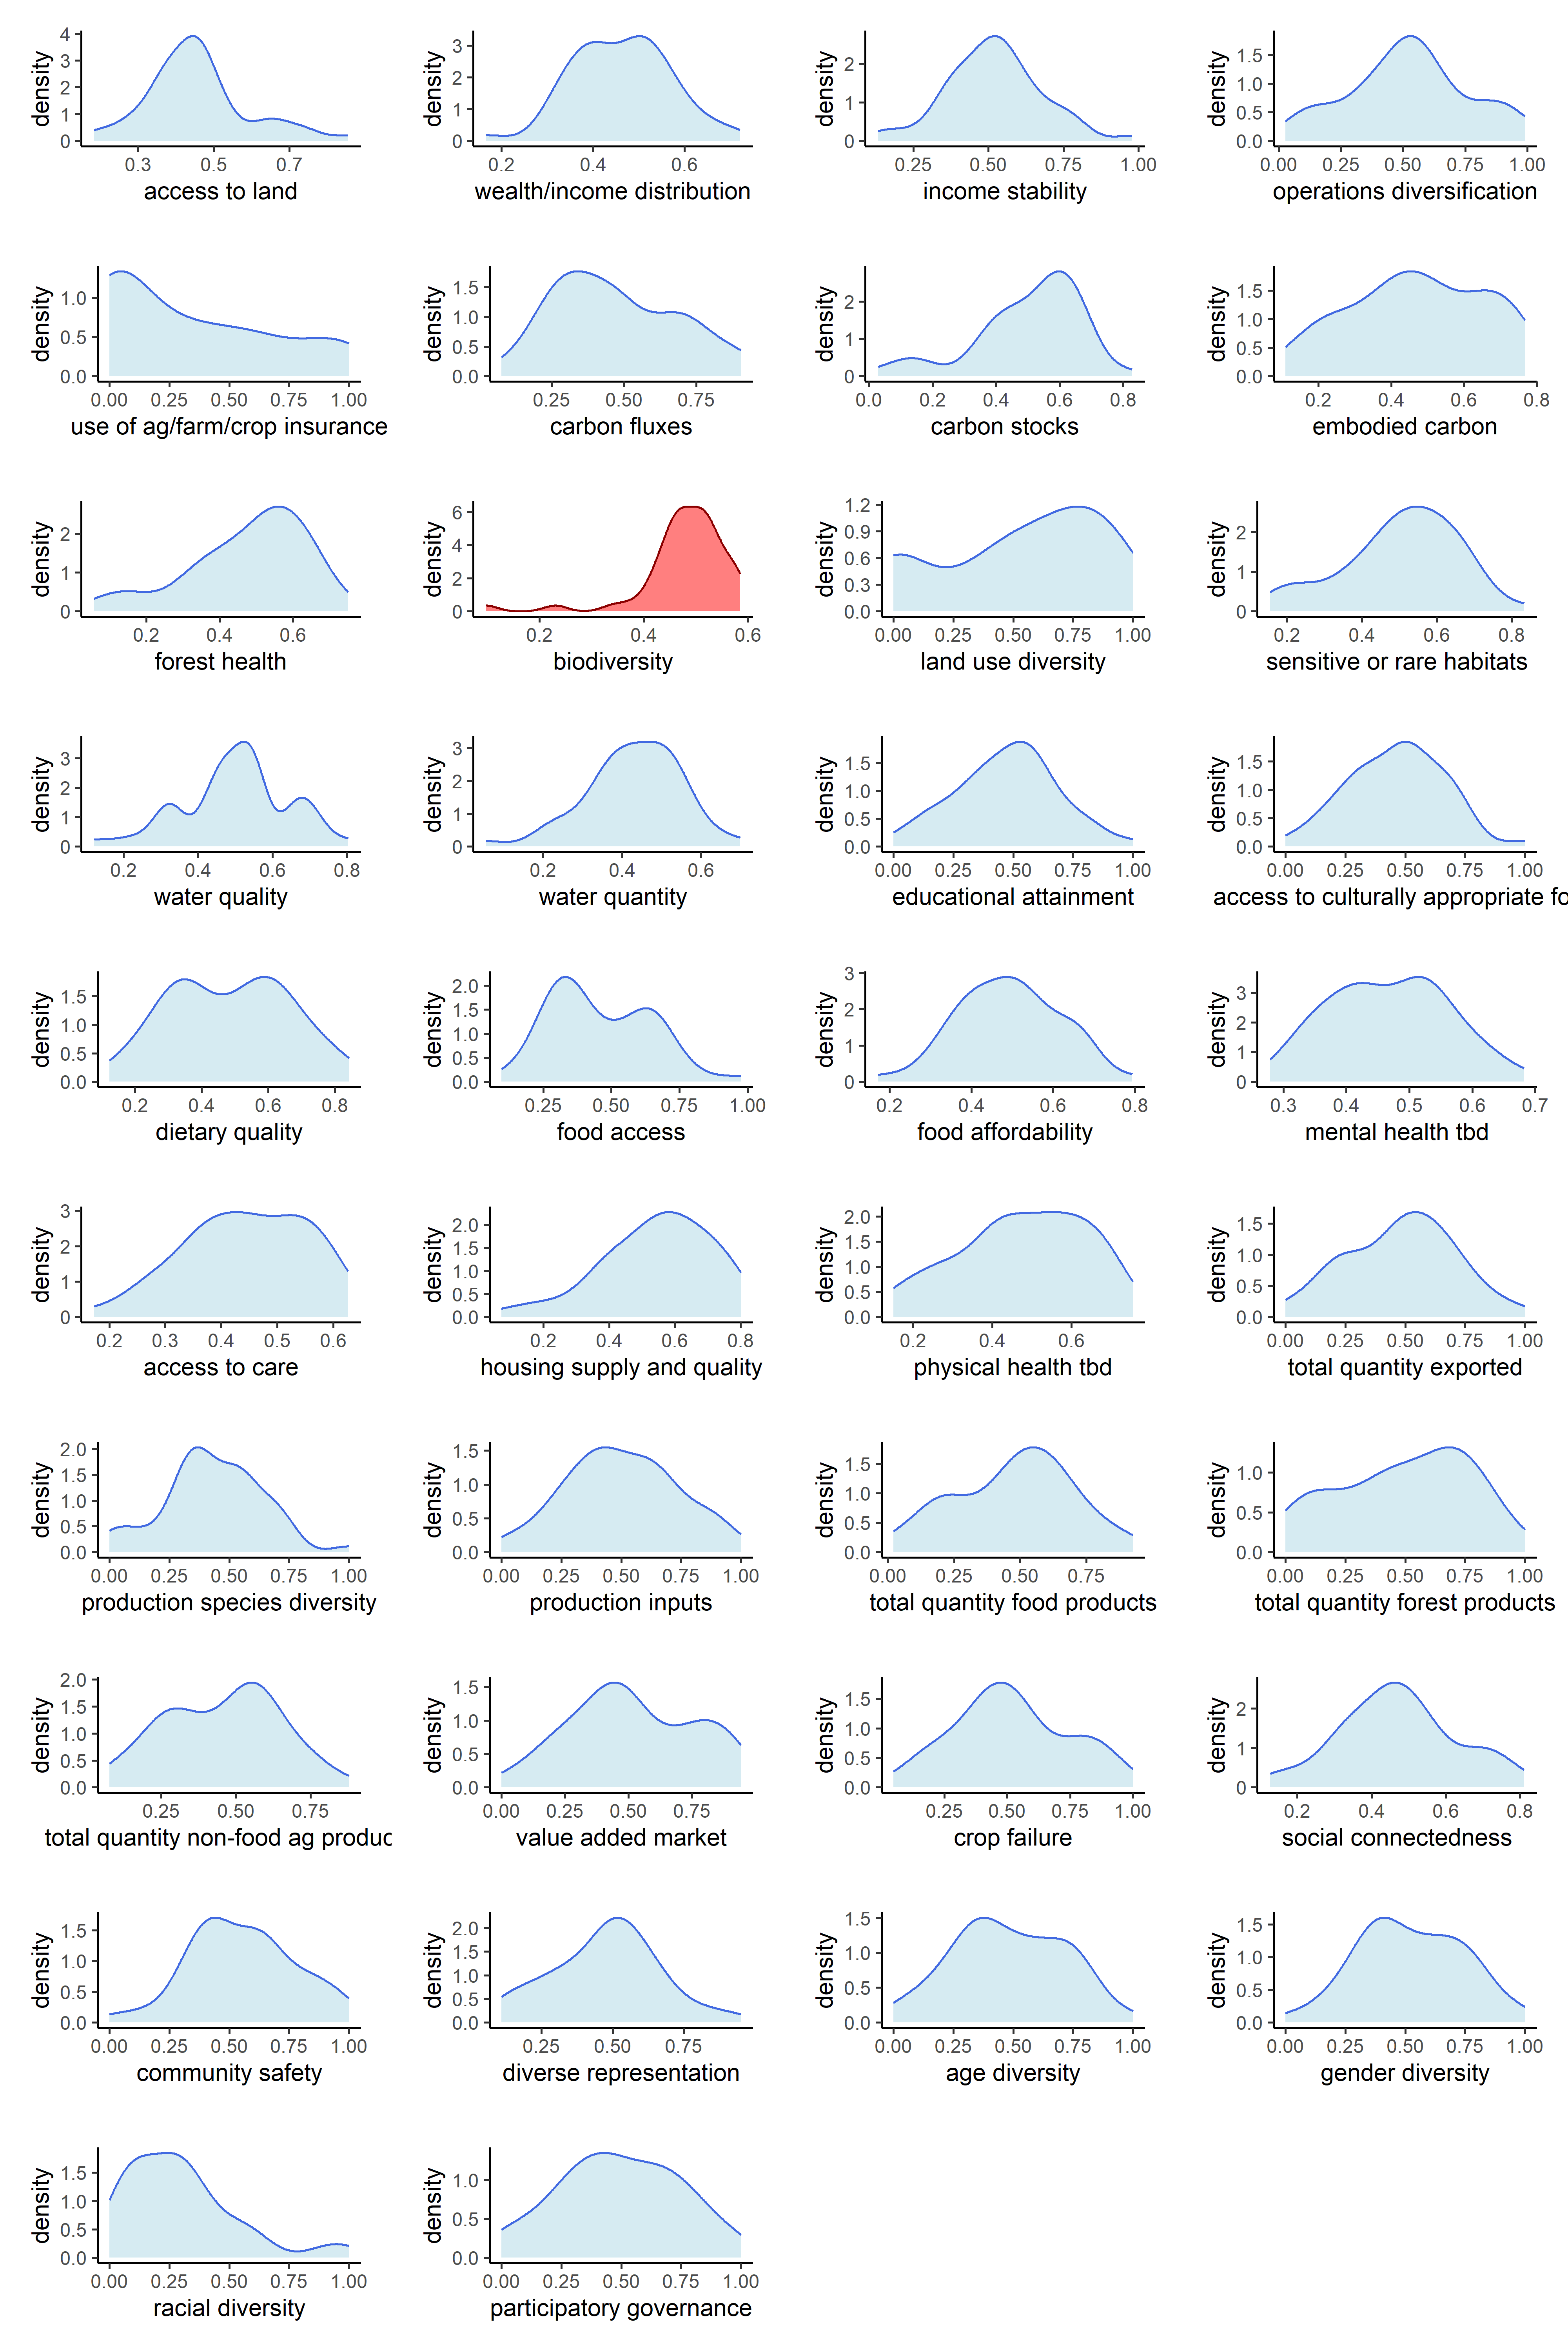
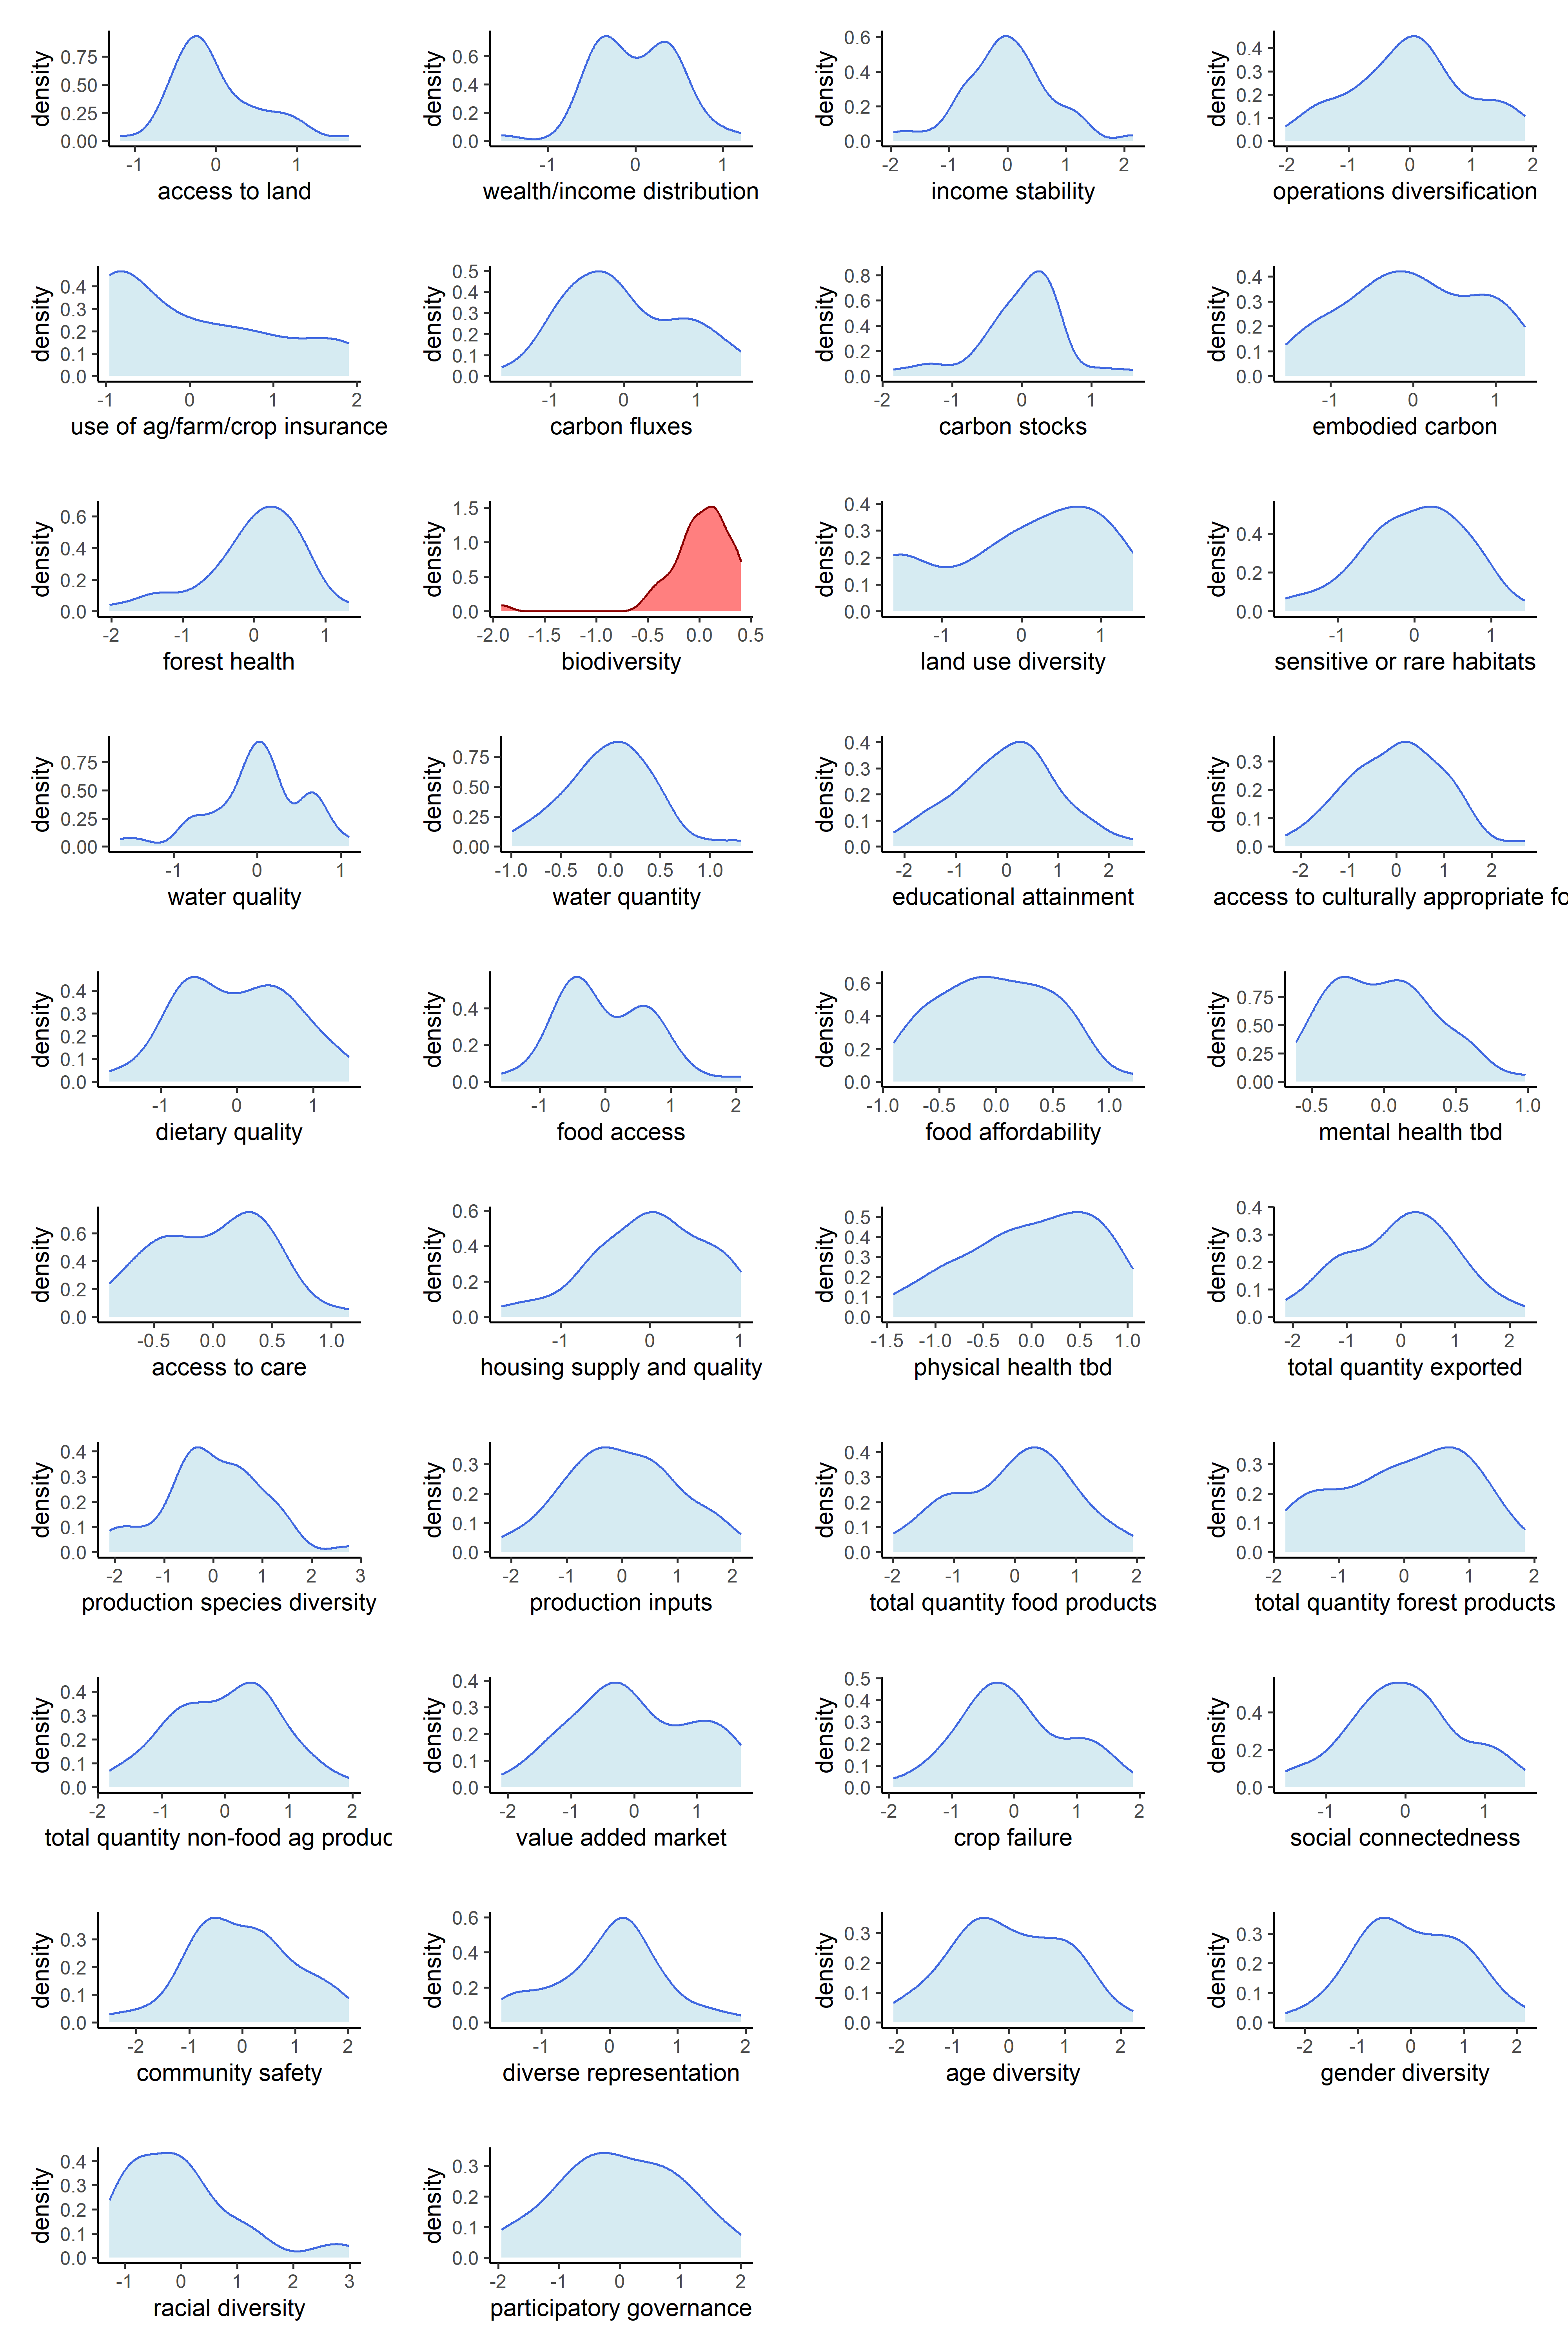
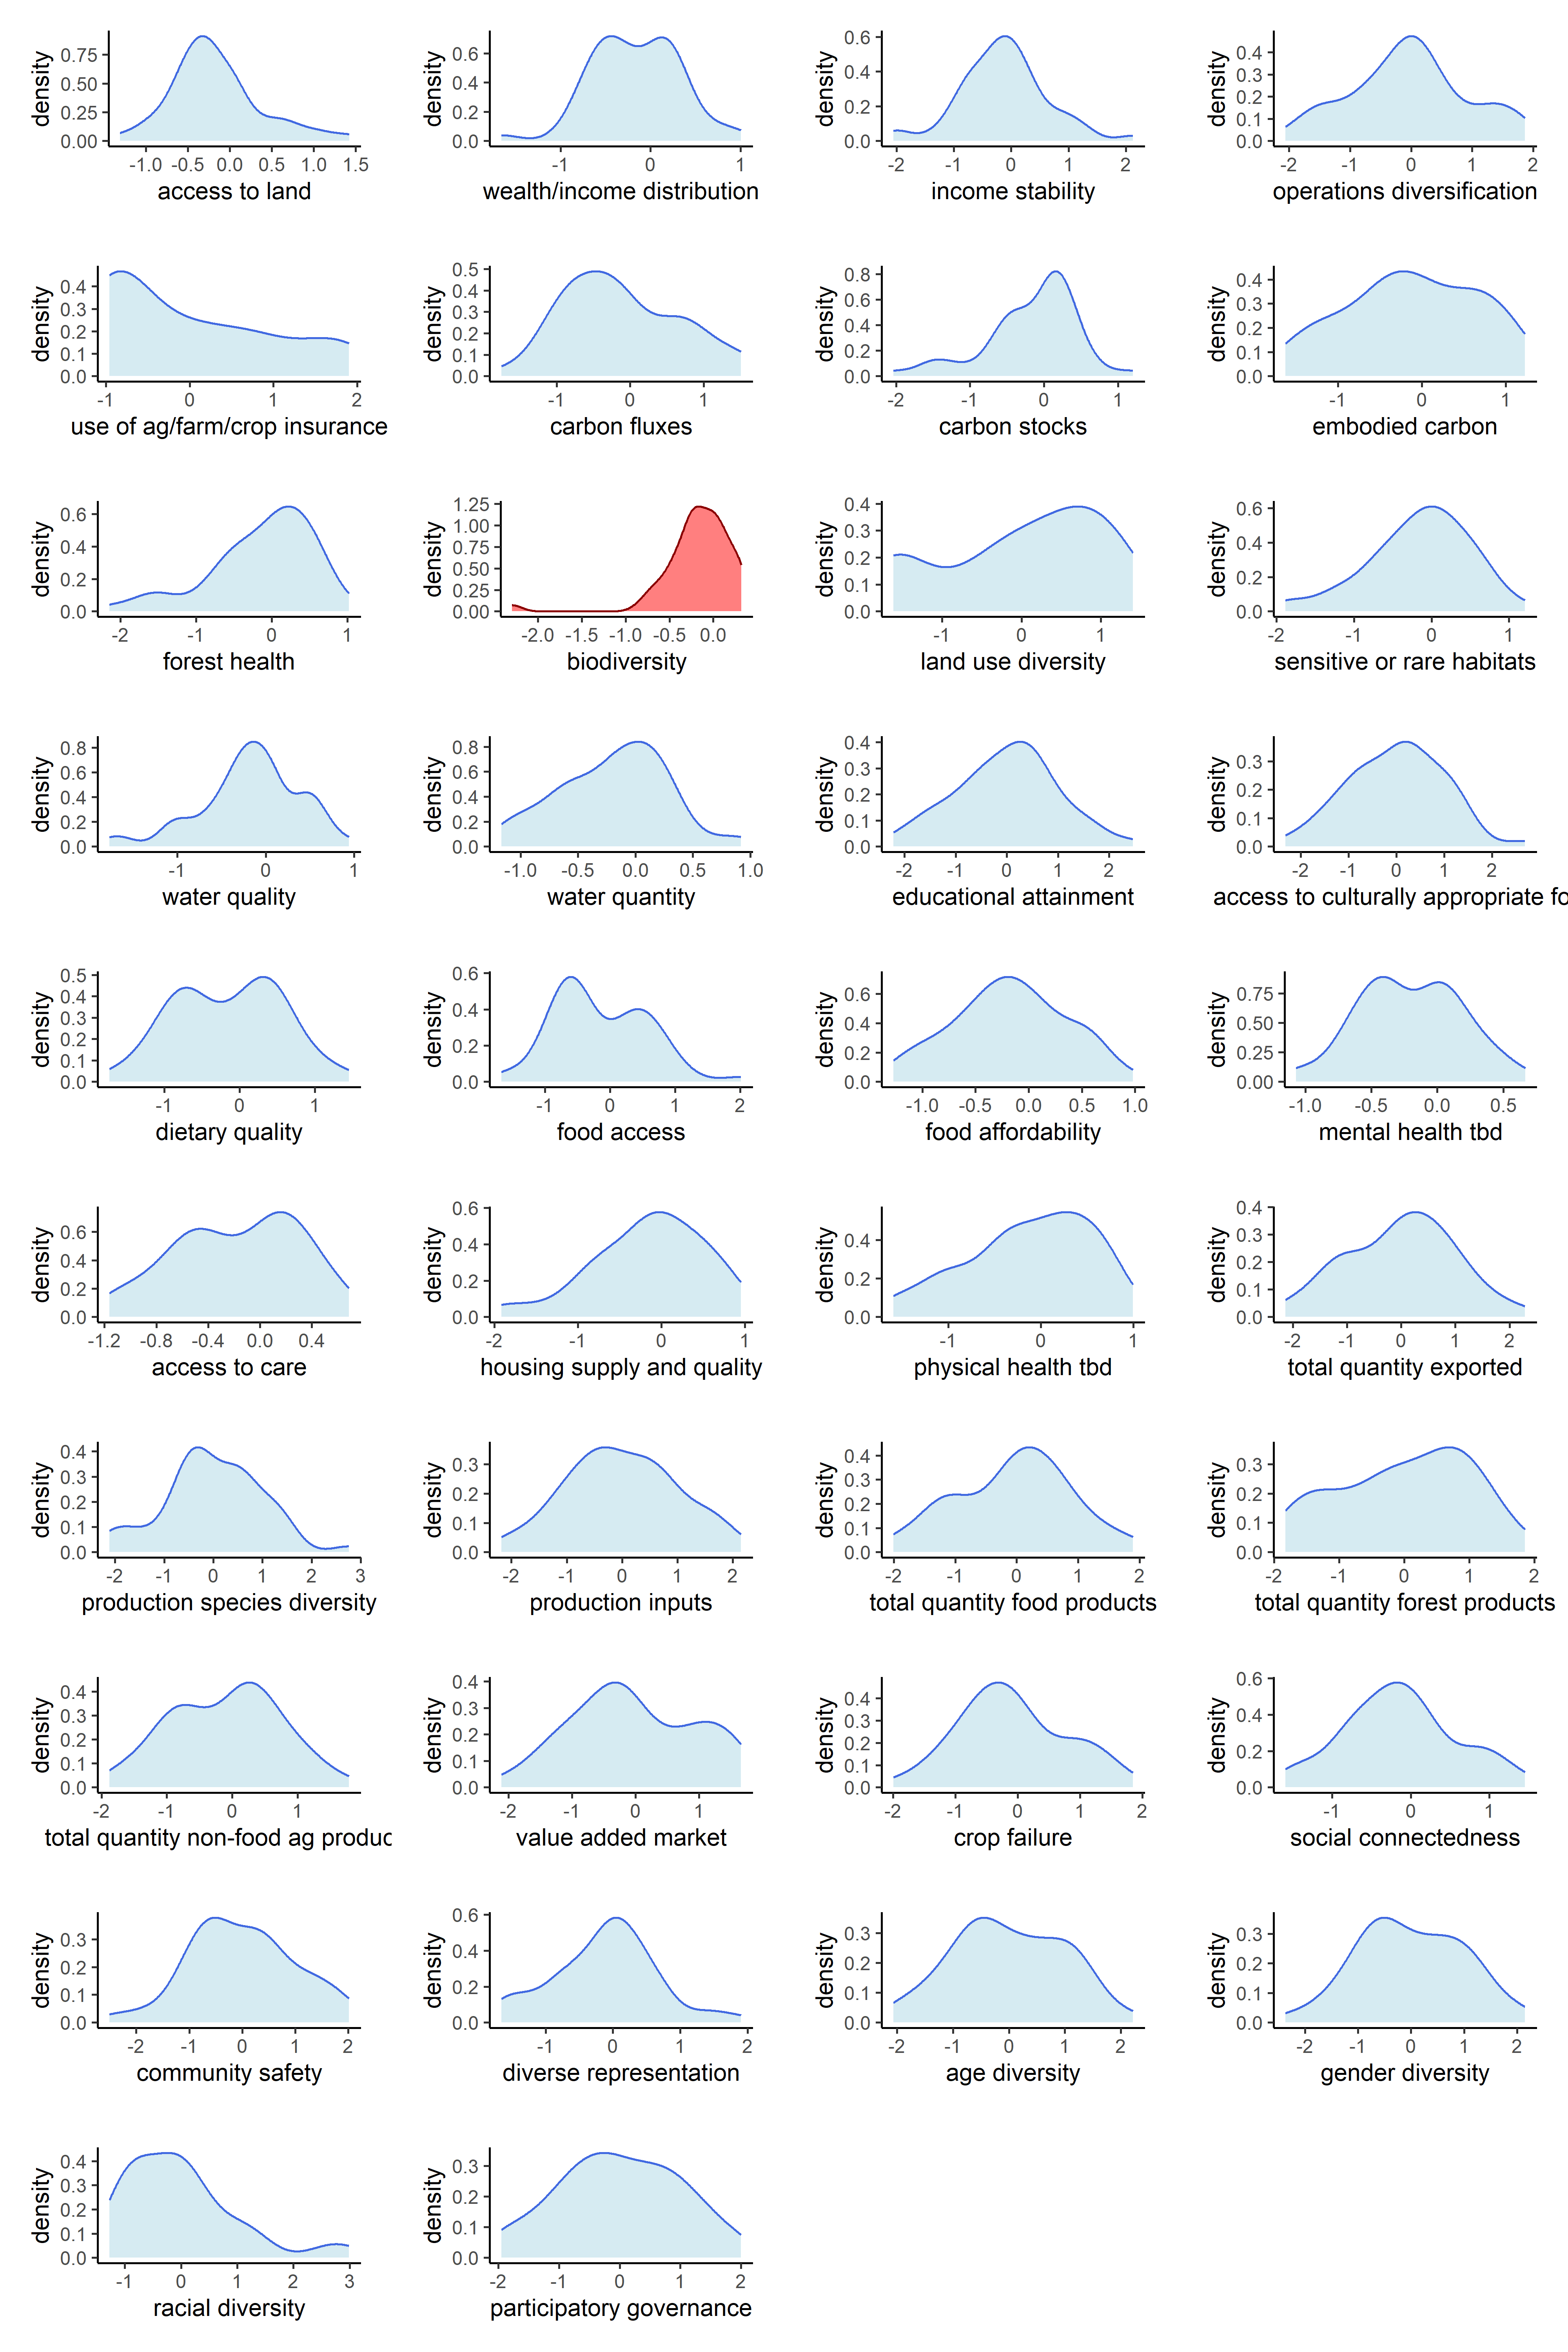
Now that our metrics have been aggregated into indicators, we can observe the univariate distributions of the indicators themselves. We will do this for all six sets of transformations.
1 Summary
Below are counts of skewed indicator distributions for each transformation.
Code
# Load scores data for all transformationsscores <-readRDS('data/state_score_iterations.rds')get_str(scores)# Rearrange data to make a single DF as tableout <-map_vec(scores, ~ { .x[['indicator_scores']] %>% dplyr::filter(str_detect(state, 'US_|NE_', negate =TRUE)) %>% dplyr::select(-state) %>% psych::describe() %>% dplyr::select(skew) %>% dplyr::filter(abs(skew) >2) %>%nrow()}) %>%as.data.frame() %>% tibble::rownames_to_column() %>%setNames(c('Transformation', 'Indicators with Skew > 2')) %>%arrange(Transformation)out