Food systems are both significant contributors to climate change being and increasingly threatened by it. Sustainability is critical in meeting nutritional needs within ecological bounds, and achieving it depends on access to targeted and actionable data. Sustainability indicator frameworks provide a scaffolding for data collection. While most assessments are conducted at the national or farm level, regional approaches are effective because cooperation among state and local government is feasible and stakeholders share common context.
We use a comprehensive indicator framework assessing the Northeast food system across five dimensions of sustainability to conduct a survey of publicly available data, including coverage, quality, and trends. We found key gaps in indicators of local economies, crop failure, farmer values, and food system governance. Some critical data were only available at the state level, like carbon emissions from agriculture. Further, monitoring of some metrics began only recently, precluding analysis over time. We identified 62 metrics fitting the framework, but only 30 were available at the county level with enough data to assess trends. Of these, half were improving, and one third were declining.
Access to accurate and targeted data is critical in improving regional food system sustainability. The gaps we identified should serve as a road map in developing monitoring programs. However, public datasets also contain biases, and misinterpretations are common. When used judiciously, the curation of datasets that are consistent, compatible, and easily accessed will be crucial in monitoring food systems and developing appropriate policies and interventions
2 Introduction
This section of pages presents the analysis and most of the data wrangling for a survey of available food system sustainability data in the Northeast. For details on data collection and cleaning, see the FSRI SMdata repository.
Wiltshire et al. (2024) describe the development of the Sustainability Metrics framework on which this work is based. It builds on the “three pillar” model of sustainability (economic, environment, and health) (Barbier 1987), and adds two more dimensions: production and social. We used a set of seven criteria to collect available data relevant to the Northeast based on this foundation. Metrics used in the framework should:
be representative of their indicators
leverage the finest spatial scale available
adequately cover counties across the nine states in the Northeast
cover a long period of time, where possible
represent each indicator with as few metrics as is feasible
reflect the intended unit of analysis of each indicator where possible
be in the public domain or under an open-source license
We surveyed a range of public data sources to fit the indicator framework according to these criteria, including federal agencies (USDA, BLS, Census Bureau), academic studies (University of Wisconsin County Health Rankings), as well as NGO and crowdsourced data (NatureServe, iNaturalist). We focus on regional data because of the ability of regional institutions to make policy changes (Clancy and Ruhf 2010), and the county level as this is often finest resolution at which much secondary data are organized. The following pages show what data we found, describe their quality and characteristics, and present some analyses of their relationships and trends over time.
Note that we have taken some liberties with consolidating the framework that can be seen in the graphs and tables below to make the material a bit more presentable as framework refinement continues.
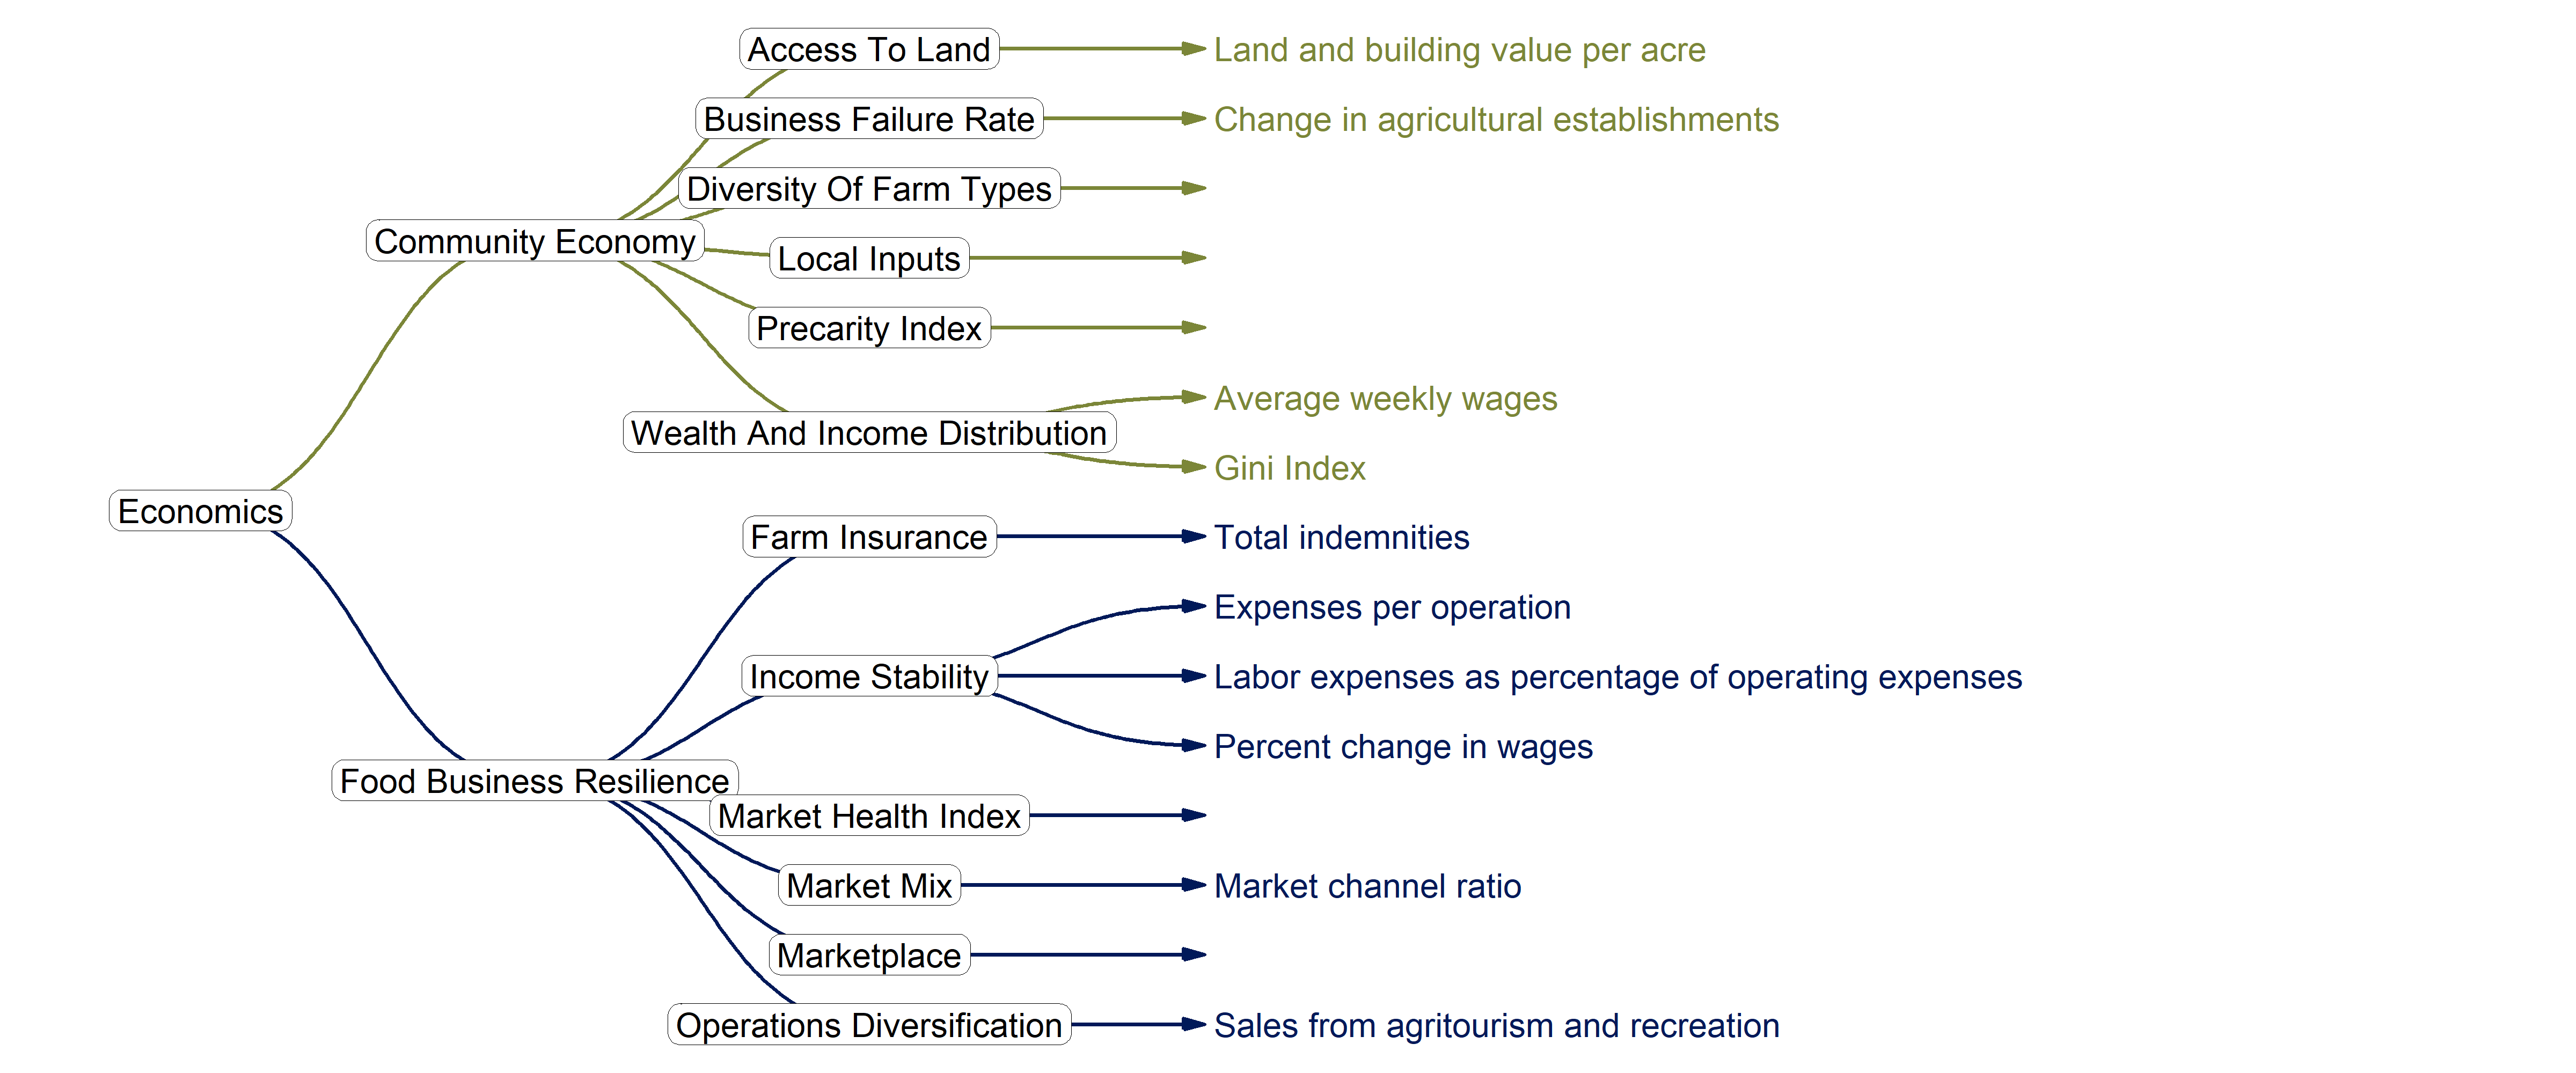
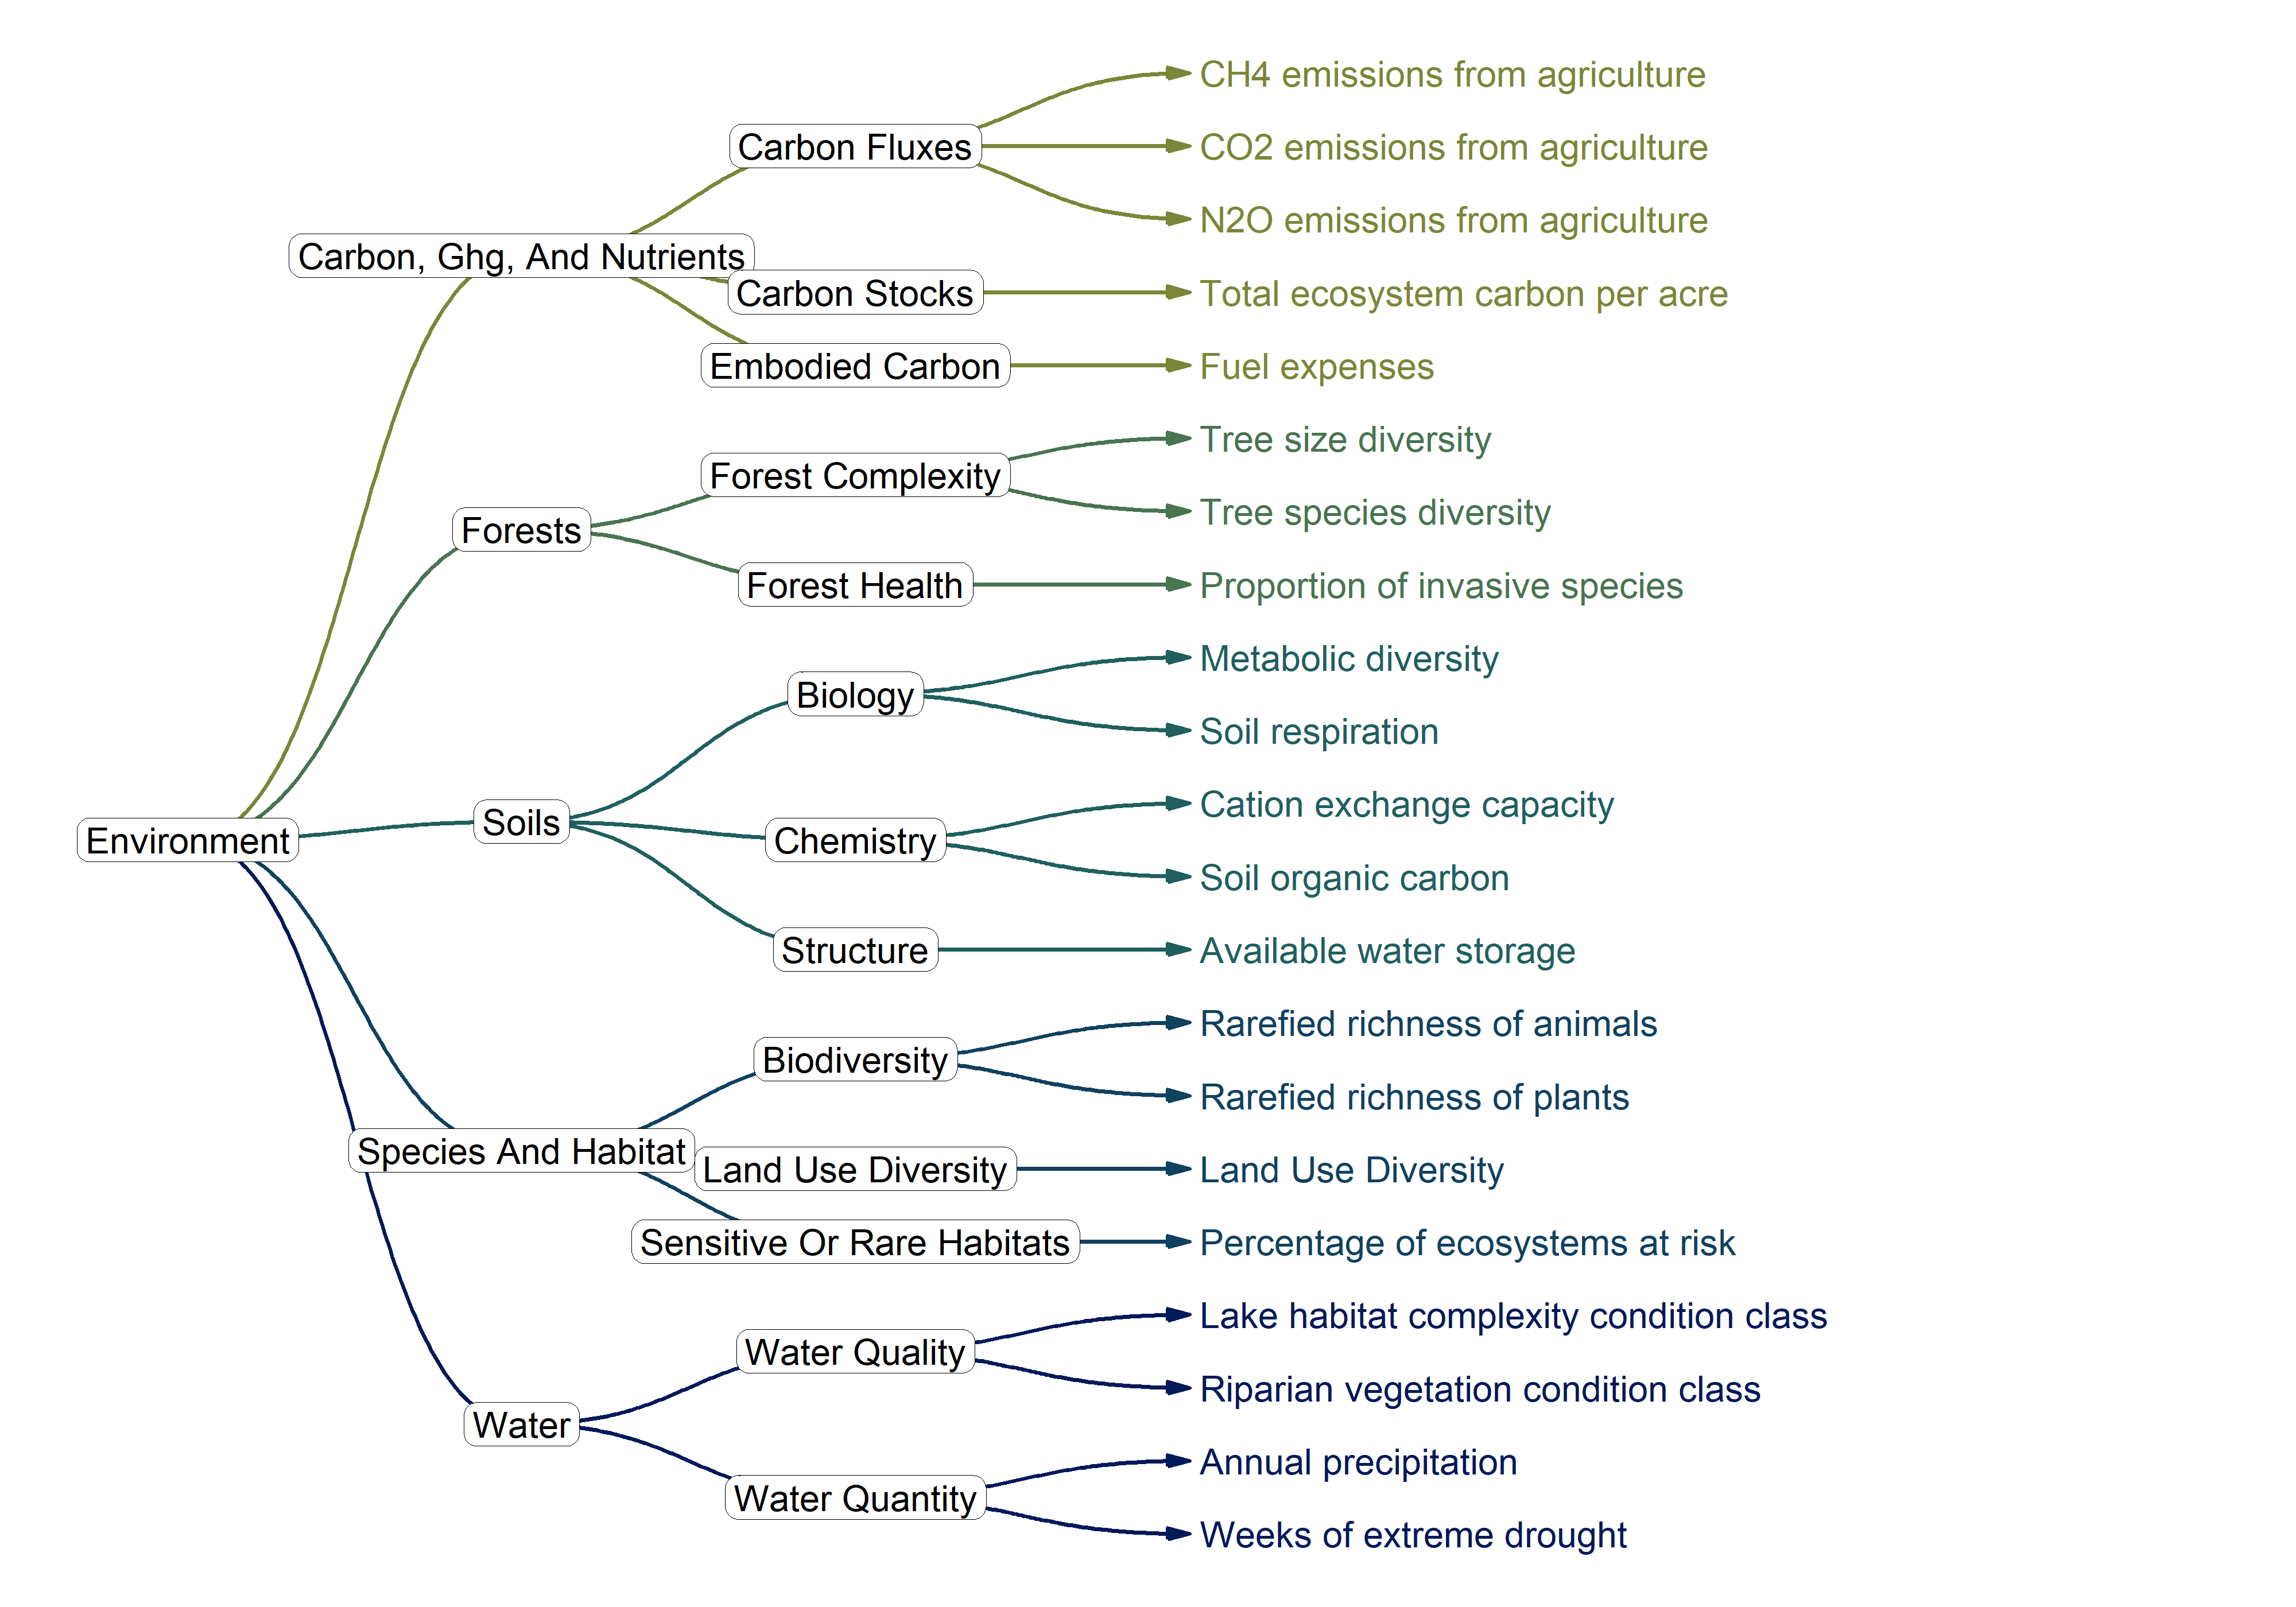
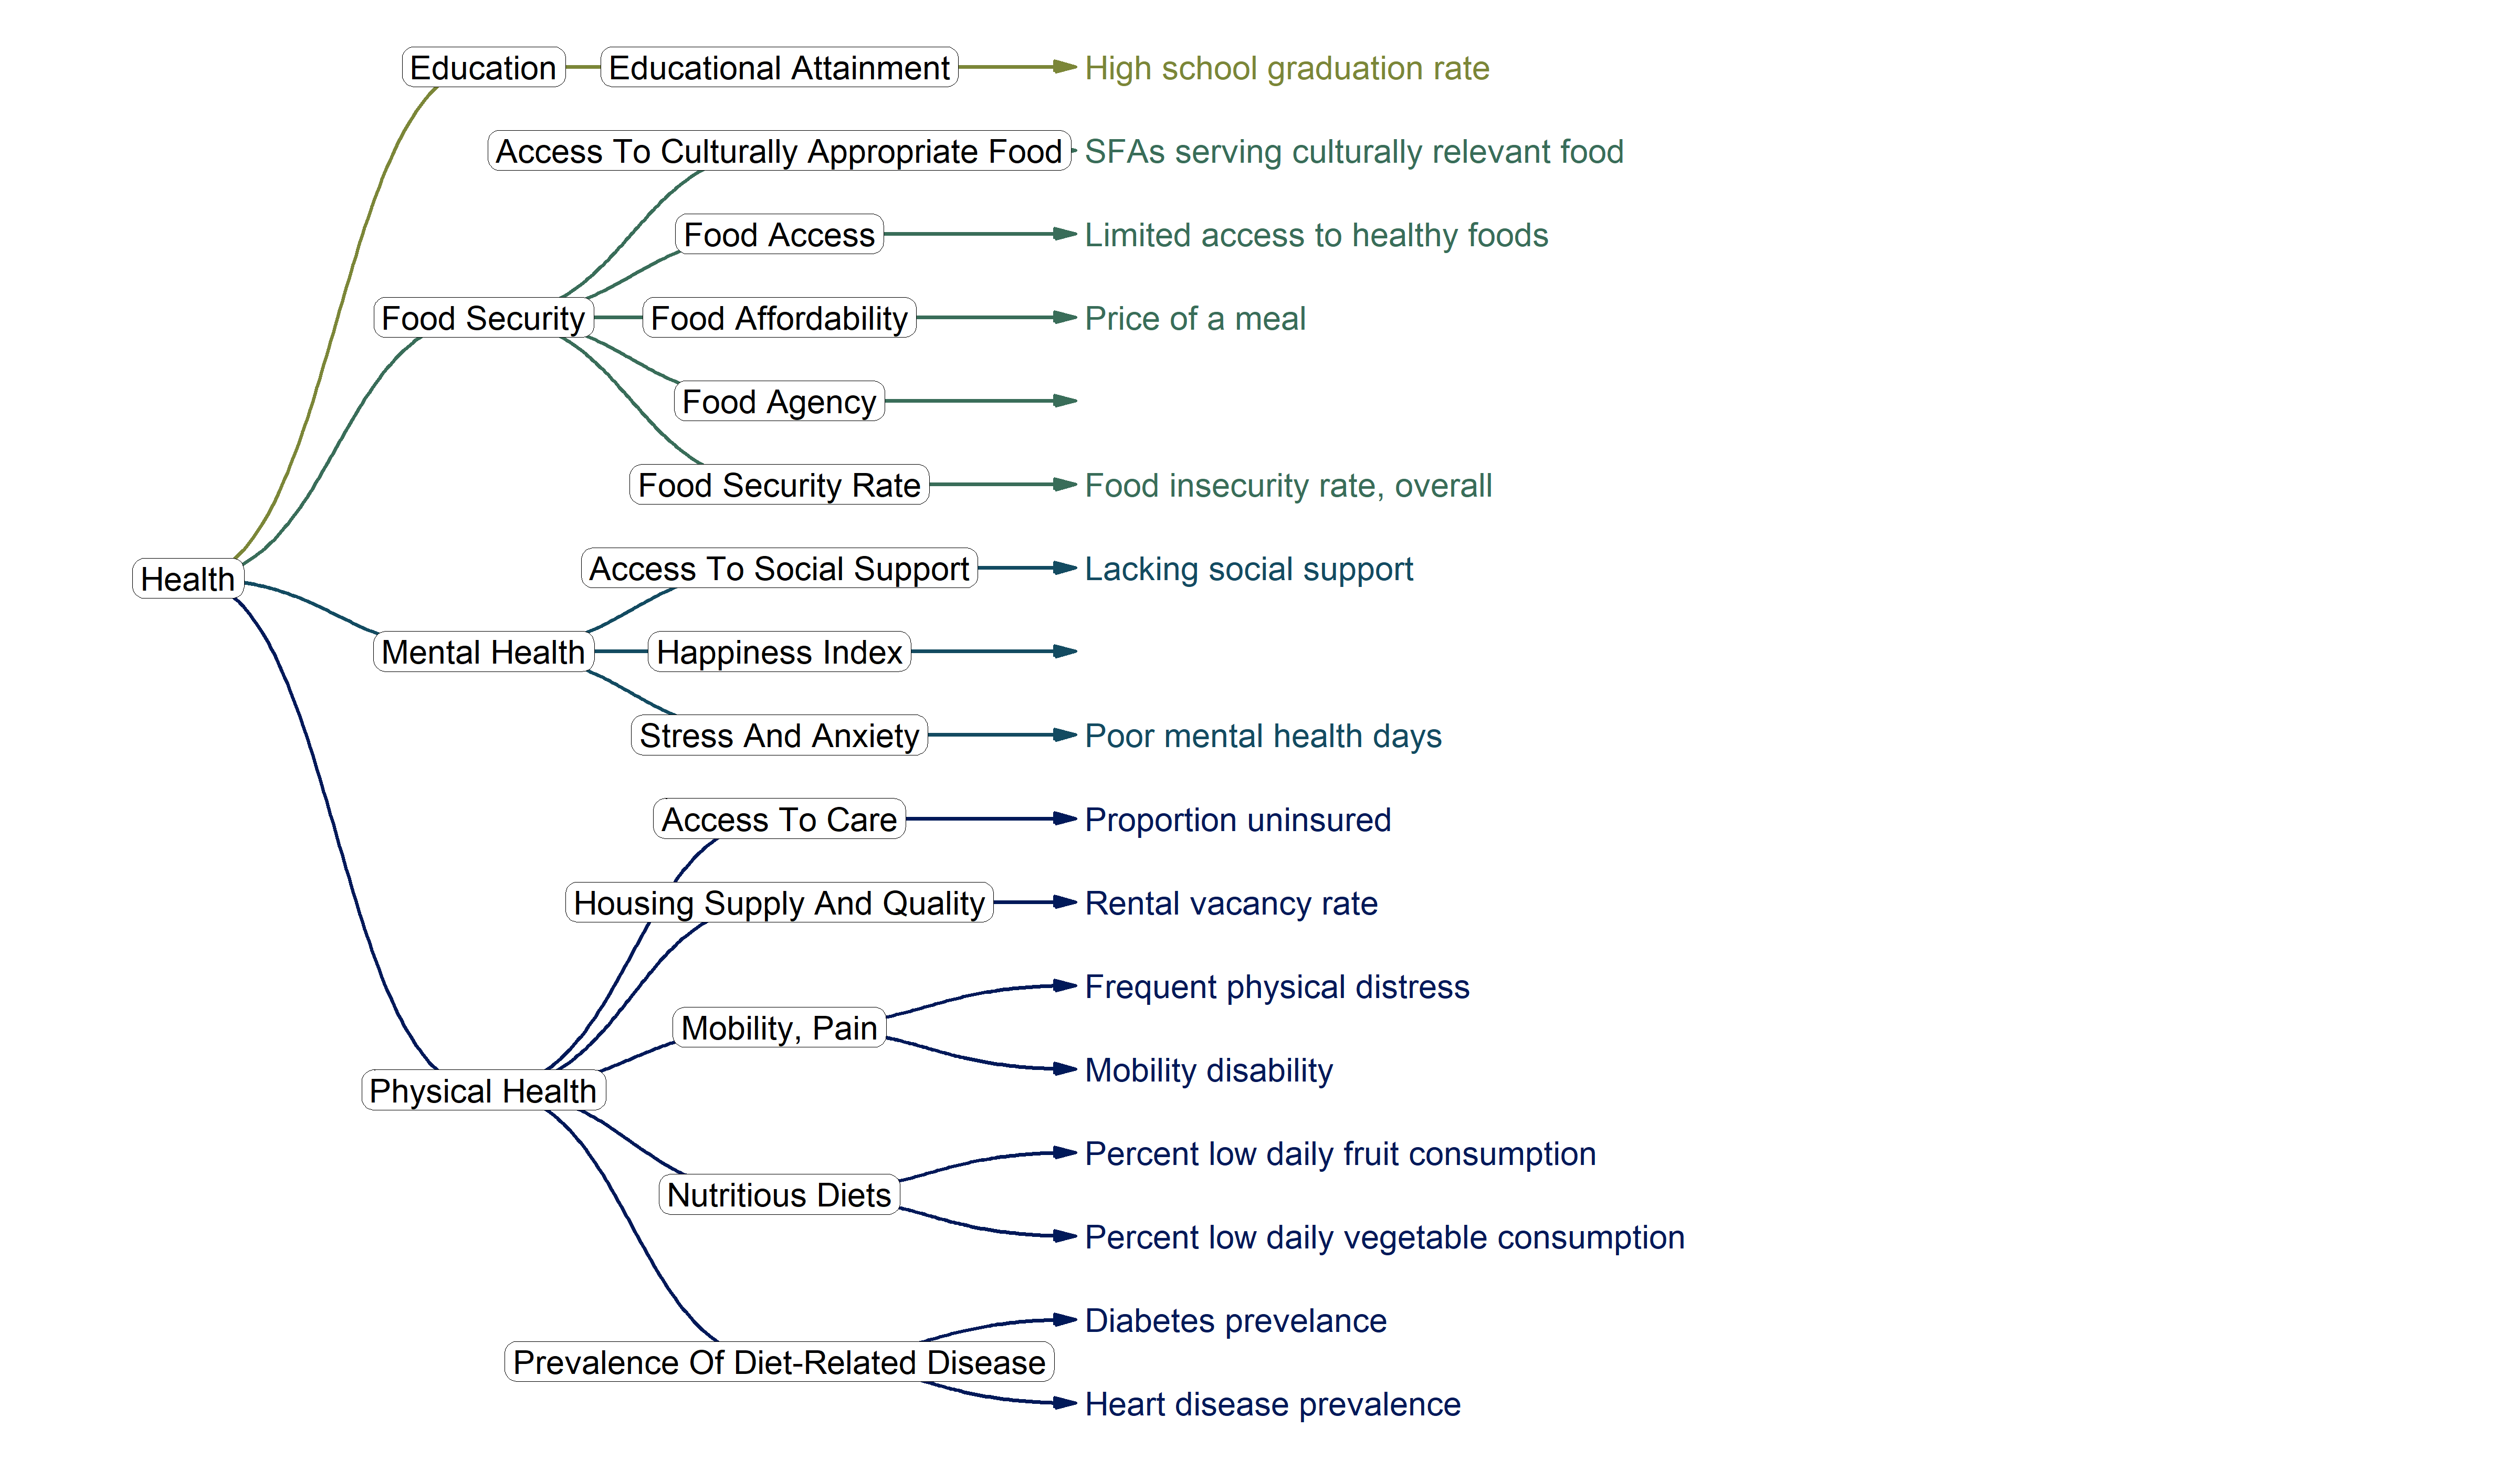
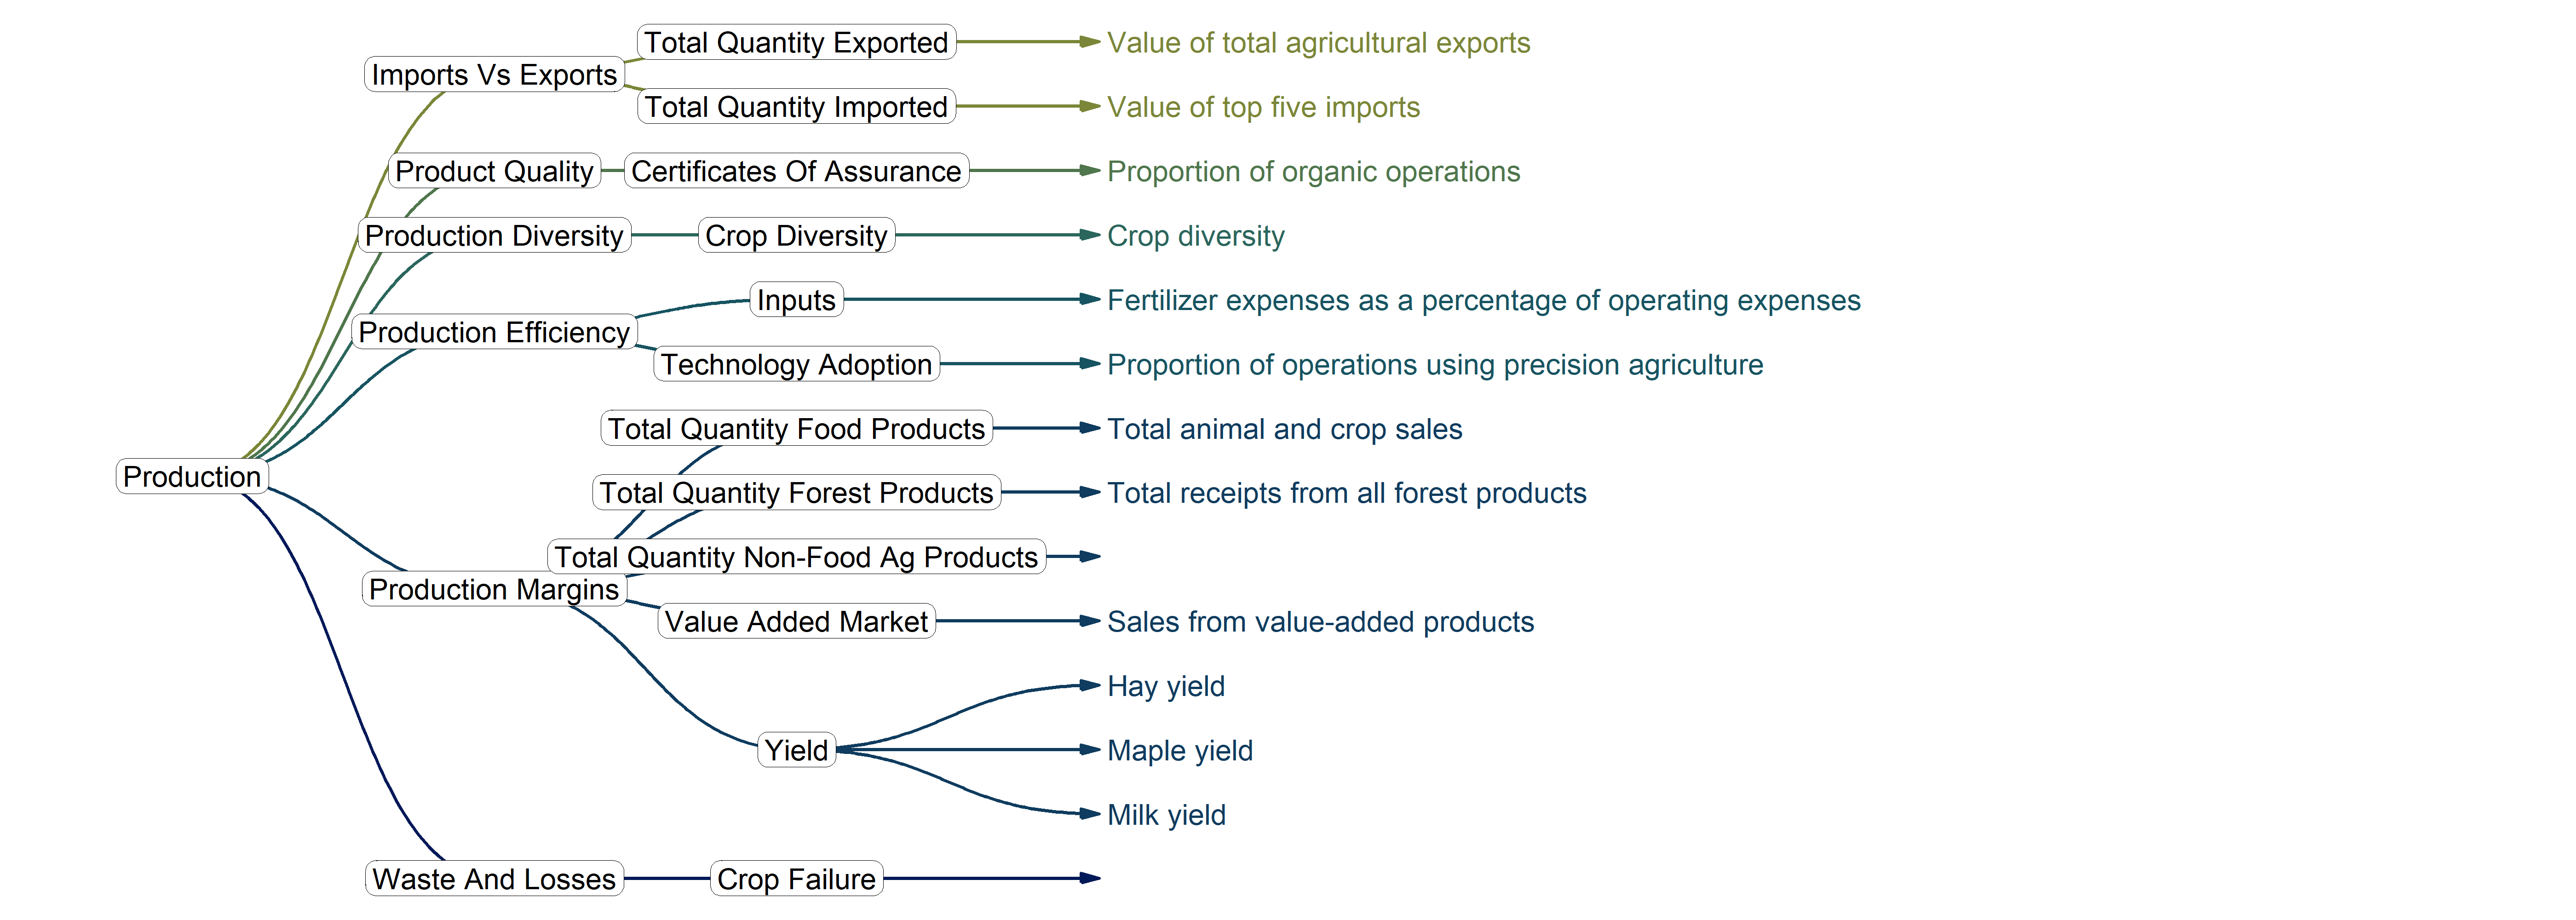
3 Dimension Graphs
This section shows dendrograms of each dimension and the available data at the county level, if any. From left to right, the graphs show the dimension, index, indicator, and secondary data metrics that are available.
The code and analyses here are publicly available under a GPLv3 License. Note that each page has a “setup” chunk at the very top that loads required packages and datasets. This is shown on this intro page, but not on the subsequent pages as they are rather repetitive. For more details, you can visit the SMdocs GitHub Repository where you will find unabridged analyses and package dependencies.
Code
r
tree <- SMdocs::dp_tree %>%mutate(indicator =case_when(str_detect(indicator, 'inputs bought locally') ~'% local inputs',str_detect(indicator, 'production inputs') ~'production inputs',str_detect(indicator, 'metabolic') ~'presence of disease',.default = indicator ) %>%str_remove(' of food business'),metric =paste0(' ', metric) )# Set up list of resultsplots <-list()
Same information as above, but perhaps a bit easier to explore. Use the search bar at the top to search through all fields, or the filter fields at the top of each column for finer control.
Clancy, Kate, and Kathryn Ruhf. 2010. “Is Local Enough? Some Arguments for Regional Food Systems.”Choices 25 (1). https://doi.org/10.22004/ag.econ.93827.
Wiltshire, Serge, Brian Beckage, Chris Callahan, Lisa Chase, David Conner, Heather Darby, Jane Kolodinsky, et al. 2024. “Regional Food System Sustainability: Using Team Science to Develop an Indicator-Based Assessment Framework.”Journal of Agriculture, Food Systems, and Community Development 14 (1): 1–24. https://doi.org/10.5304/jafscd.2024.141.011.
3.5 Social
Code